This workshop continues using the Data for Crime Rates in Local Government Areas in New South Wales. Open “nsw-lga-crime-2023.sav” again in SPSS. If you are not sure how to open it, please see Workshop 5: Exploring NSW Crime Data.
Selecting cases
Selecting cases
Sometimes we want to carry out an analysis for a specific group (e.g., young people, women, the unemployed, etc.) rather than for all cases in the sample. If you want to do such a sub-group analysis, you need to define a sub-set of a sample by specifying selection criteria and then selecting cases that meet the selection criteria. This procedure is called “subsetting”, and SPSS provides a way for subsetting. Suppose that we want to analyse crime rates only in urban LGAs of NSW. The first step is to select only urban LGAs from the entire LGAs.
Go to Data > Select Cases.
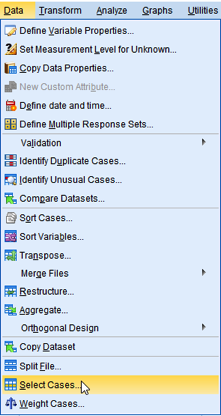
Figure 1: <Figure 1>
You will see the box of Select Cases.
Let’s take a look at the box. The section of Select provides several methods for subsetting. The default, All cases, includes all cases for the analysis. However, we will use the next option, so 1) choose If condition is satisfied. 2) In the section of Output, choose Filter out unselected cases, which will exclude unselected cases from the analysis. Then, 3) click If just below “If condition is satisfied” in the section of Select.
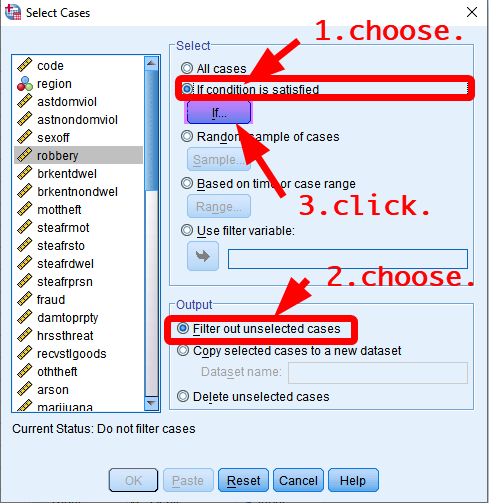
Figure 2: <Figure 2>
You will see the box of “Select Cases: If” in which you can set criteria for selecting cases. The selection criteria should be expressed using basic SPSS operators. <Table 1> shows basic SPSS operators and how these can be used for selecting cases.
| Expression | Meaning | Example |
|---|---|---|
| = | Equal | urban=1: if urban equals to 1 |
| ~= | Not equal | urban~=1: if urban does not equal to 1 |
| < | Less than | age<30: if age is less than 30 |
| <= | Less than or equal to | age<=30: if age is less than or equal to 30 |
| > | Greater than | age>30: if age is greater than 30 |
| >= | Greater than or equal to | age>=30: if age is greater than or equal to 30 |
| & | AND: all the conditions hold | age>30 & age<40: if age is greater than 30 AND less than 40 |
In the box of Select Cases: If, 1) type “urban=1” in the box at the top. urban has two values: 0 means ‘rural’ and 1 mean ‘urban’. Thus, “urban=1” makes SPSS to select only urban LGAs. 2) Click Continue at the bottom. Then, you will be back to the previous box (Figure 2). 3) Click OK at the bottom.
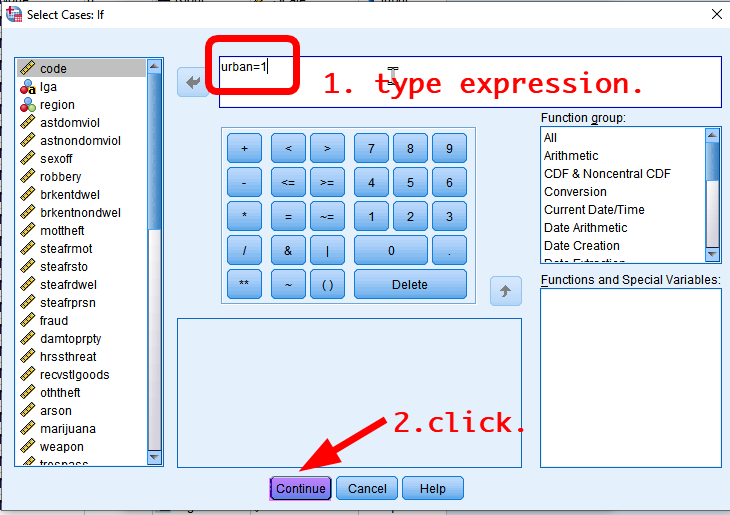
Figure 3: <Figure 3>
Go to Data View. You will see a new variable titled “filter_$” at the rightmost column (see <Figure 4>). The variable has a value 1 if the case is selected in the subset and 0 otherwise. But you don’t need to do anything with this filtering variable. So, ignore this variable.
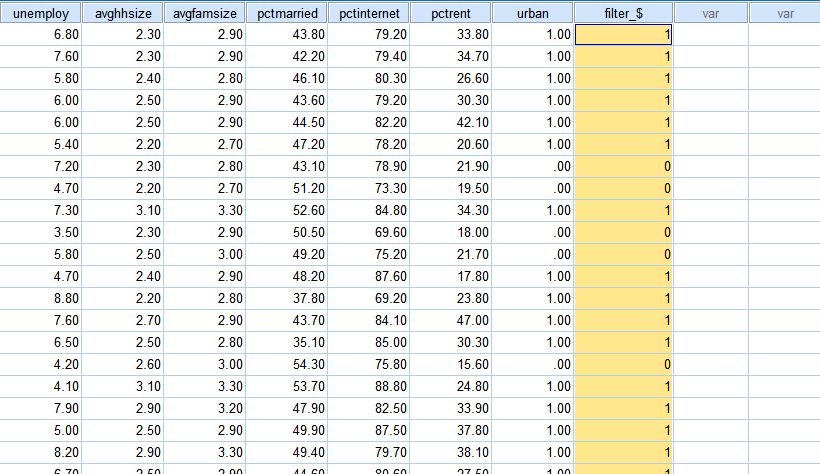
Figure 4: <Figure 4>
Note that any analysis you conduct after this point will be done ONLY for the selected subset. For example, let’s make a frequency table for urban. As seen in <Figure 5>, only urban LGAs are included in the analysis.
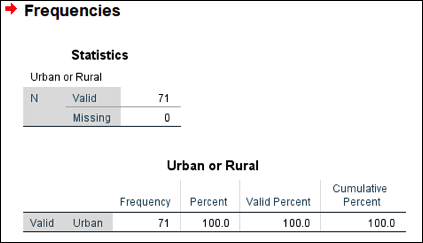
Figure 5: <Figure 5>
Deselecting cases
When you want to stop using the subset you defined in the previous section, you need to turn off subsetting.
Go to Data > Select Cases again. In the box of Select Cases, click Reset at the bottom. You will see “All cases” chosen in the section of Select (see <Figure 6>). Click OK at the bottom. After then, the future analysis will be done for all cases.
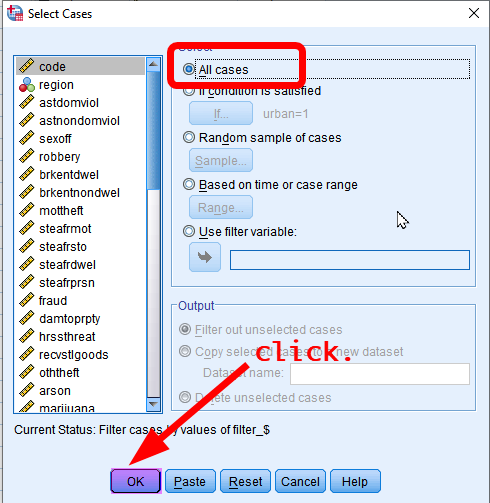
Figure 6: <Figure 6>
Categorising continuous variables
Sometimes we want to transform a continuous variable into a categorical variable (either an ordinal or a nominal variable). Using an income variable, we may want to classify people into several income groups such as high-income, middle-income, and low-income groups. How can we do this kind of categorisation using SPSS? You may remember that recoding variables can do this job (see Creating a new variable of age groups).
Suppose that we want to classify LGAs into two categories depending on the average income of households: 1) “High 50% LGAs” with the average household income being above the median and 2) “Low 50% LGAs” with the average household income being below the median. This is called median-splitting by which all cases will be split into two groups with the equal size of cases. Of course, there are other ways to categorise income groups such as using more refined percentiles (e.g. quantiles, quintiles) or even tax-brackets. But median-splitting is the simplest and easiest method and can be used for preliminary analysis. In this workshop, we will use the median as a cut point to categorise LGAs into two income groups.
Obtaining values that split cases
This task requires you to split all the LGAs into two groups depending on their values in the median household income variable (the variable name is medinc). Also, we want each group to have the equal size of cases so that “High income LGA” group has 50% of all cases and “Low income LGA” group has another 50% of all cases. The first step of this procedure is to calculate the cut point by which all the cases are split into two equal-size groups.
- Go to Analyze > Descriptive Statistics > Frequencies.
- Choose a variable by which cases will be split (in this example, it is medinc)
- Click Statistics in the box of Frequencies.
- Tick “Cut points for ⸏⸏⸏ equal groups” under the section of Percentile Values. Type the number of groups you want to make (in this example, it is 2).
- Click Continue at the bottom. You will be back to the previous box.
- Click OK at the bottom.
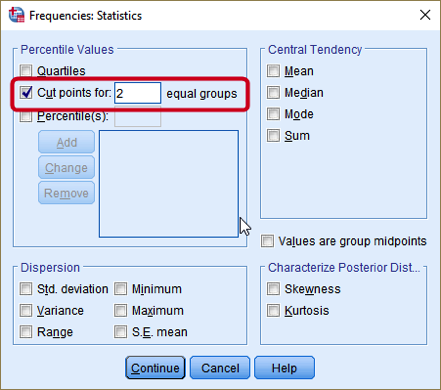
Figure 7: <Figure 7>
The output shows the cut point, which splits all the cases by half (see <Figure 8>). As you may notice, 939 is the median value for medinc. The next step is to make a new variable using this cut point.
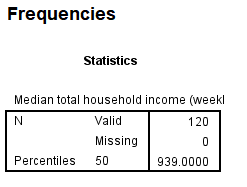
Figure 8: <Figure 8>
Recoding variables using cut points
This section will use the same steps as in Recoding variables.
First, 1) Go to Transform > Recode into Different Variables. In the box of Recode into Different Variables, 2) choose medinc in the left pane and move it to the right pane. 3) Type medinc2 as a Name of Output Variable and “median income – two groups” as a Label. 4) Click Change. 5) Click Old and New Values. In the box of Recode into Different Variables: Old and New Values, 6) choose “Range, LOWEST through value” and type the cut point that we calculated in the previous section, which is 939. Then, 7) type 1 in the section of New Value. This tells SPSS to recode all the LGAs with median income below 939 into 1. 8) Click Add.
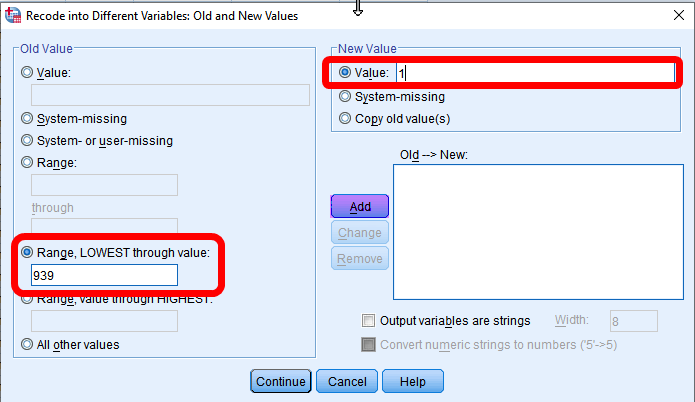
Figure 9: <Figure 9>
Next, 9)Choose “Range, value through HIGHEST” and type the cut point (939). Then, 10) type 2 in the section of New Value. All the LGAs with median income higher than 939 will be recoded into 2. 11) Click Add. 12) Choose “System- or user-missing” in the section of Old Value, “system-missing” in the section of New Value. 13) Click Continue at the bottom. You will be back to the previous box. 14) Click OK at the bottom.
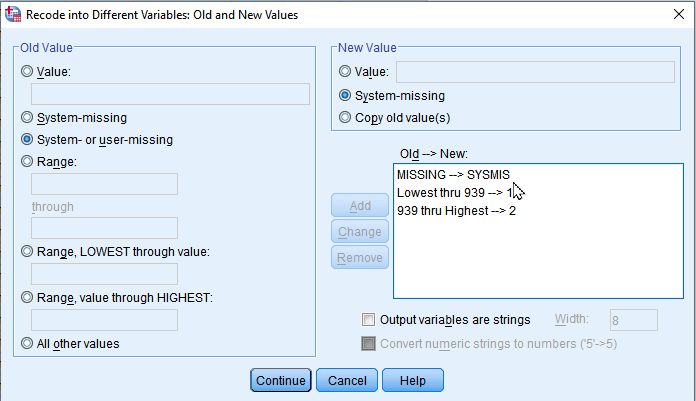
Figure 10: <Figure 10>
Go to Variable View. You will see a new variable named medinc2 at the bottommost row. 15) Assign an appropriate level of measurement (Ordinal) and value labels (1 = “Lower 50%”; 2 = “Upper 50%”).
Make a frequency table of this newly created variable to check whether the variable is created correctly.
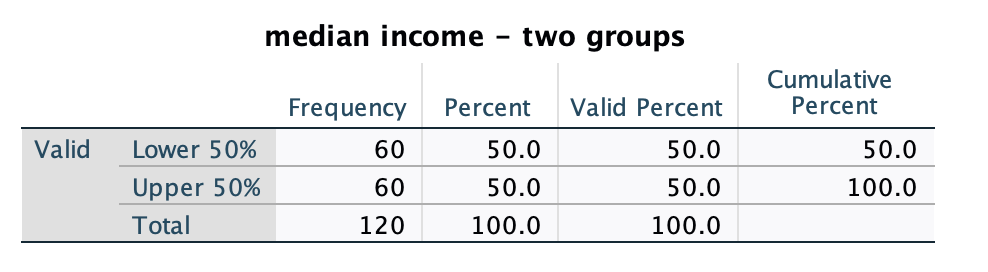
Figure 11: <Figure 11>
As seen in the <Figure 11>, the same number of cases are included in each group.
Practice: Recoding variables using cut points |
|
You NEED to do this practice for the next section. In the same way you made medinc2, make a new variable (unemploy2) that splits all LGAs into two groups: upper and lower 50% with respect to unemployment rates (unemploy). We will use unemploy2 in the next section. |
How to make a new variable by combining the existing two variables
This section introduces a more complicated recoding scheme which uses two variables simultaneously. Suppose that we want to classify LGAs with reference to both medinc2 and unemploy2 as in <Table 2>. If you did not make unemploy2, make it following the instruction in the Practice above.
| medinc2 | unemploy2 | Value | Label |
|---|---|---|---|
| 1 | 1 | 1 | low income, low unemployment |
| 1 | 2 | 2 | low income, high unemployment |
| 2 | 1 | 3 | high income, low unemployment |
| 2 | 2 | 4 | high income, high unemployment |
There may be several ways to create this new variable, incunemp4. Using Compute might be one way. But this section will make the new variable using Recode into Different Variables.
First of all, 1) Go to Transform > Recode into Different Variables. 2) In the box of Recode into Different Variables, choose unemploy2 in the left pane and move it to the right pane. 3) Type incunemp4 as a Name of Output Variable and “4 groups by income and unemployment” as Label. 4) Click Change. 5) Click If.
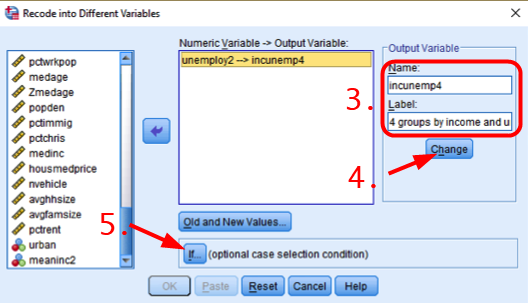
Figure 12: <Figure 12>
We first specify the recoding scheme of employ2 but ONLY FOR Low income LGAs (medinc2=1). So, we select cases having a value 1 in medinc2. In the box of Recode into Different Variables: If Cases, 6) choose “Include if case satisfies condition”. 7) Type “medinc2=1” in the white box, which will select only low-income LGAs. 8) Click Continue.
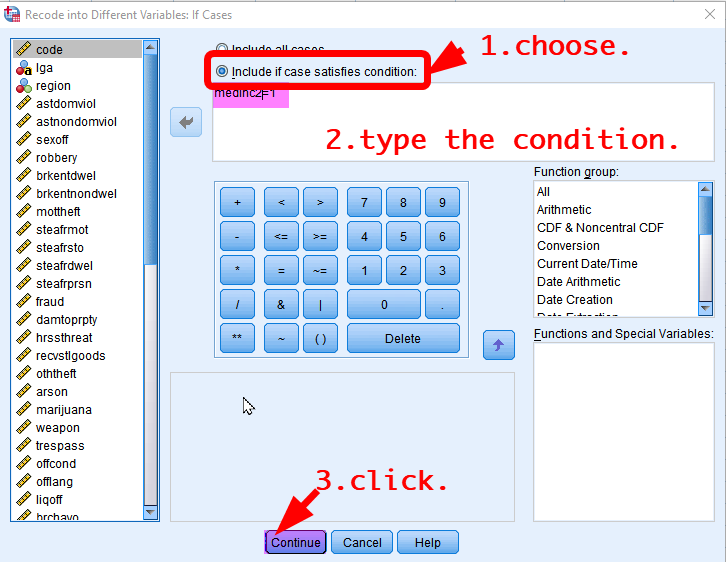
Figure 13: <Figure 13>
You will be back to the previous box. 9) Click “Old and New Values” and type 1 for Old Value and 1 for New Value. 10) Click Add. After then, 11) type 2 for Old Value and 2 for New Value. 12) Click Add. 13) Choose “System- or user-missing” in the section of Old Value, “system-missing” in the section of New Value. Click Add. 14) Click Continue at the bottom. You will be back to the previous box. 15) Click OK at the bottom.
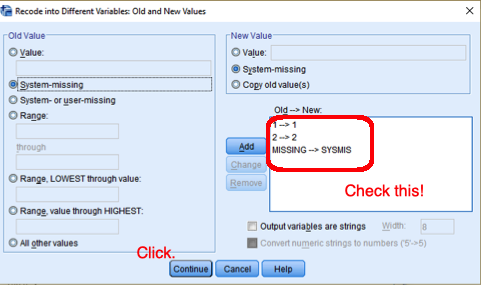
Figure 14: <Figure 14>
What you have done so far is recoding employ2 only for low-income LGAs (medinc2=1). Go to Data View. You will see that high income LGAs (medinc2=2) have missing values in the new variable, incunempl4 (see <Figure 15>). Now is the time to recode employ2 for high-income LGAs (medinc2=2).
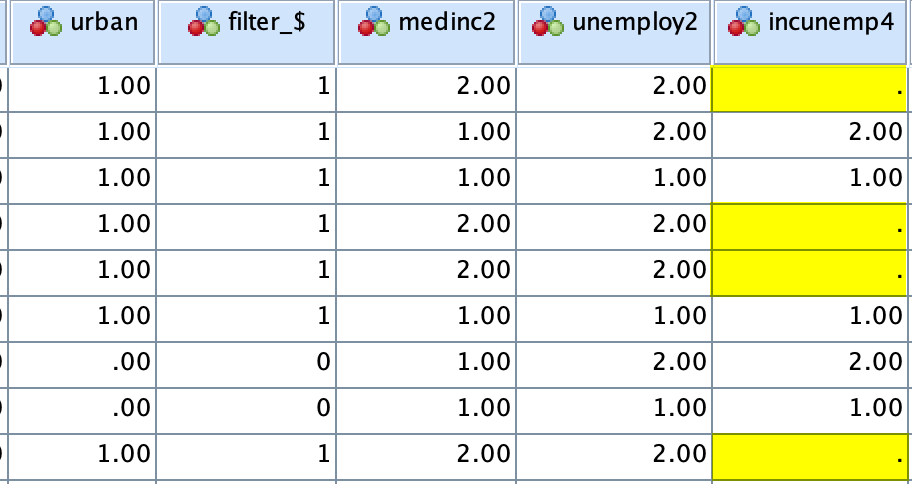
Figure 15: <Figure 15>
Next, 16) Go to Transform > Recode into Different Variables again. You will see the previous setting. We will use the same setting mostly but change the setting in the section of IF. 17) Click If again. In the box of Recode into Different Variables: If Cases, 18) change the expression into “medinc2=2”. 19) Click Continue. You will be back to the previous box. Check the condition of If has been changed (see <Figure 16>).
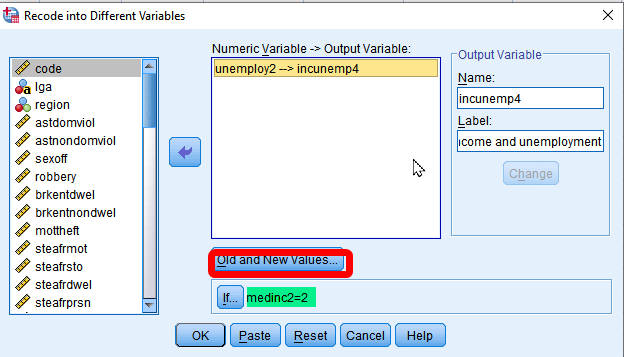
Figure 16: <Figure 16>
And 20) Click Old and New Values. In the box of Recode into Different Variables: Old and New Values, 21) click each previous old and new value and then click Remove. Now, you are ready to input a new coding scheme for high-income LGAs. Now, we will assign a value 3 and 4 in incunemp4 (see <Table 2>). 22) Type 1 for Old Value and 3 for New Value. Click Add. 23) type 2 for Old Value and 4 for New Value. 24) Choose “System- or user-missing” in the section of Old Value, “system-missing” in the section of New Value. Click Add. 25) Click Continue at the bottom. You will be back to the previous box. 26) Click OK at the bottom. Make sure you need to assign relevant value labels following Table 2.
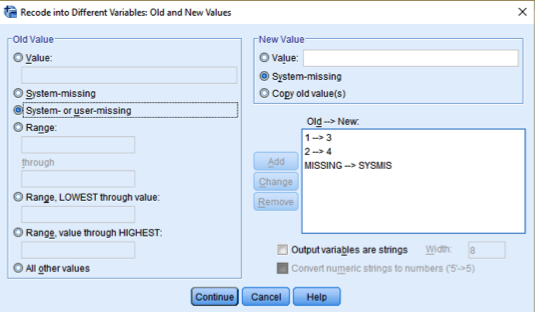
Figure 17: <Figure 17>
Sort cases by medinc2 and unemploy2 (Choose ascending orders for both variables). Then, you will be able to check whether the new variable is created correctly. If you are not sure how to sort cases, see Sorting cases.
Workshop Activity 6: Exploring Crime Rates in NSW |
WARNING: After completing Q3, you need to deselect cases before you save the file. Otherwise, your future analysis on this dataset will analyse only LGAs in the Greater Metropolitan Sydney. |