SOCI2000 Workshop 3: Experiments and Simple Tests (T-test)
Summary
If you have quantitative data that is the result of an experiment, or which is basically a comparison of the mean values of a variable in two groups, then you are most likely to want to use a t-test. This will tell you whether the difference in the mean values of the variable for the two groups is statistically significant.
|
Dataset
This workshop uses this dataset.
Independent Samples t-test
This test is used when there are two experimental conditions and different participants were assigned to each condition.
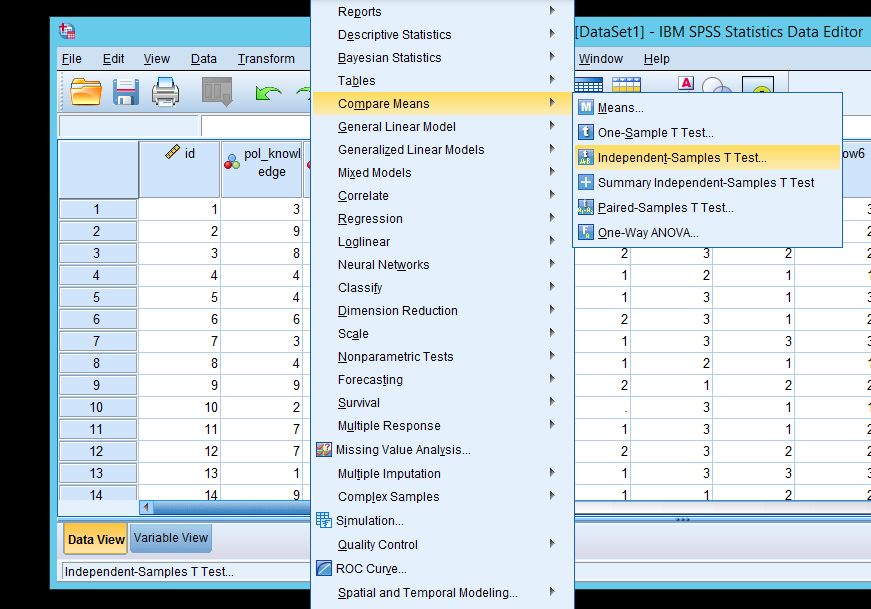
Go to Analyze under the function bar
Select Compare Means
Select Independent-Samples T test
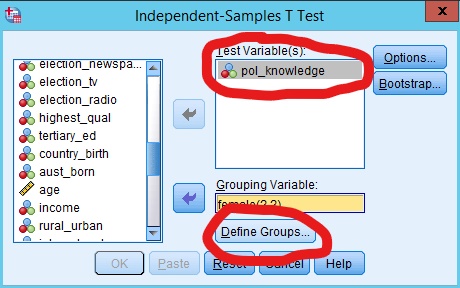
Select THE DEPENDENT VARIABLE as the test variable and GROUPING VARIABLE as the grouping variable using the buttons in the middle
Click the “Define Groups” button
- Normally we define Group 1 as 0 and Group 2 as 1
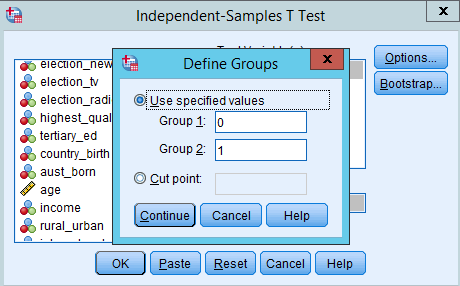
Click the Continue button
Click the OK button
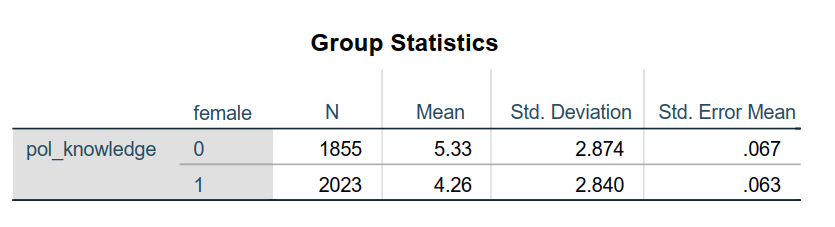
Results which look like the following will be produced:
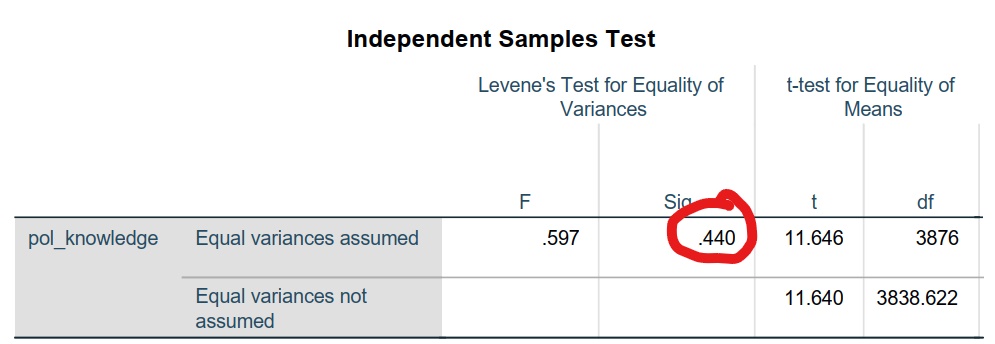
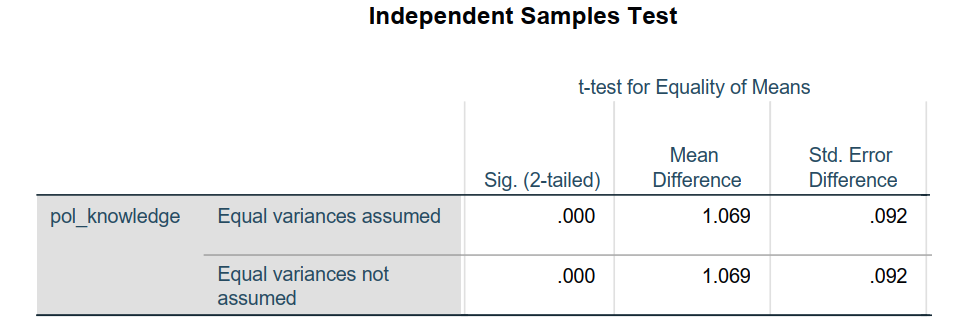
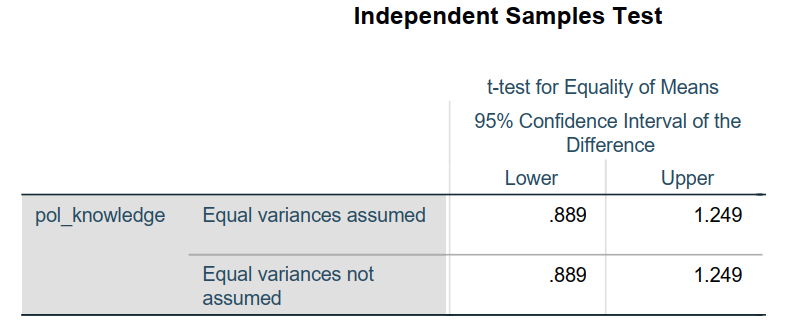
- How do you interpret these results?
Here is a quick summary:
- Look at Levene’s test for equality of variance
- If P <= 0.05, then it’s significant. Look at the Equal variances are not assumed row
- If P > 0.05, then it’s not significant. Look at the Equal variances are assumed row
- Look at the T test
- Check if p is less than or greater than 0.05
- If P <= 0.05, then it’s significant
- If P > 0.05, then it’s not significant
- If significant, we conclude that there is a significant difference between the means of these two samples.
In this particular case, equal variances are assumed (Leven’s test = .440). We conclude that there is a significant difference between females and males in their comfort level of doing the survey (T test= .000)
Paired Samples t-test
The Paired-Samples T Test procedure compares the means of two variables for a single group. The procedure computes the differences between values of the two variables for each case and tests whether the average differs from 0.
This is typically used when you employ a repeated measures design where you are testing the same people twice: you give the same person a pre-test followed by a post-test and then you compare the scores at two different times.
Go to Analyze under the function bar
Select Compare Means
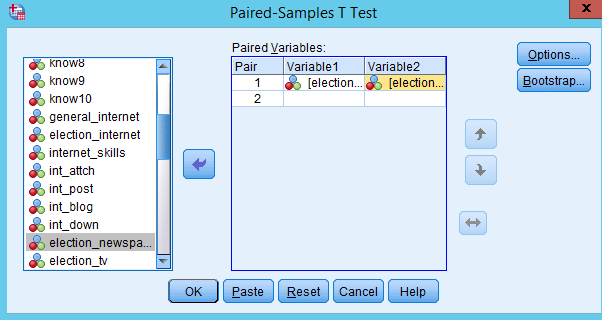
Select Paired-Samples T test
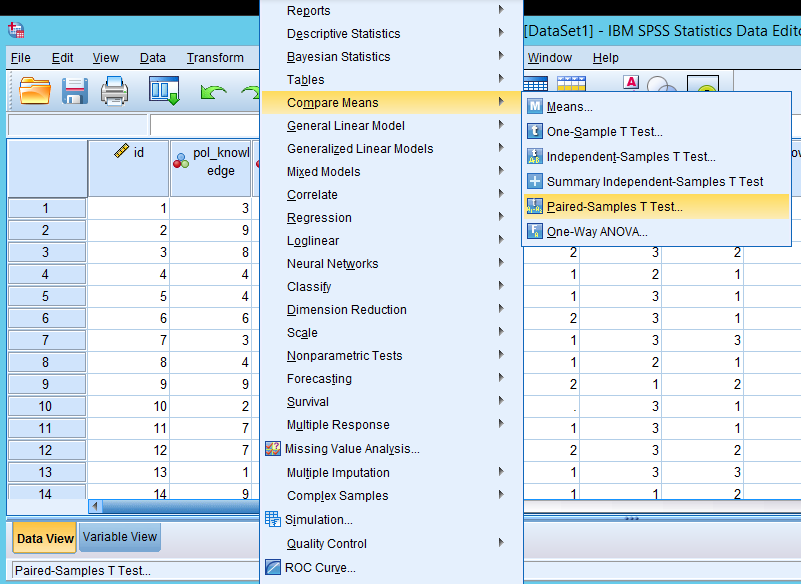
Select DEPENDENT VARIABLE MEASURE 1 as Variable 1
Select DEPENDENT VARIABLE MEASURE 2 as Variable 2
Click the OK button
- You will get output like the following:
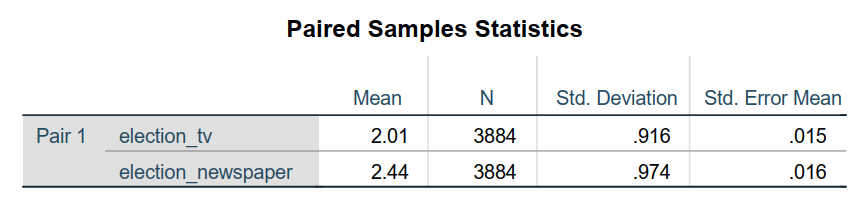
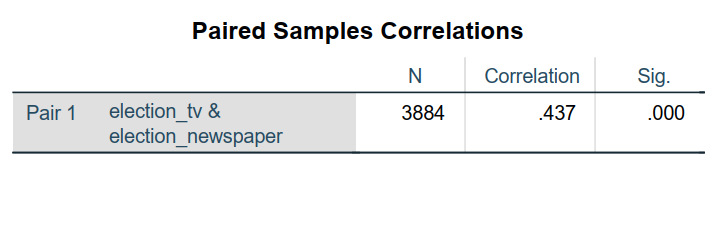
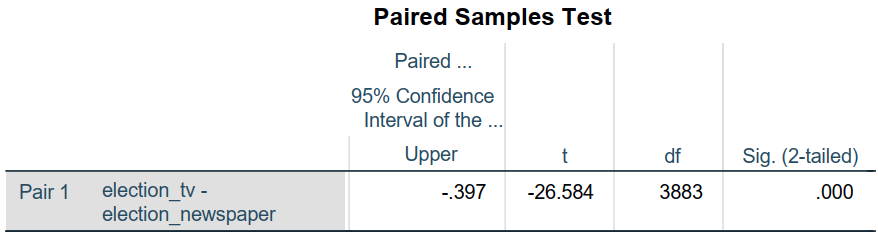
- How do you interpret these?
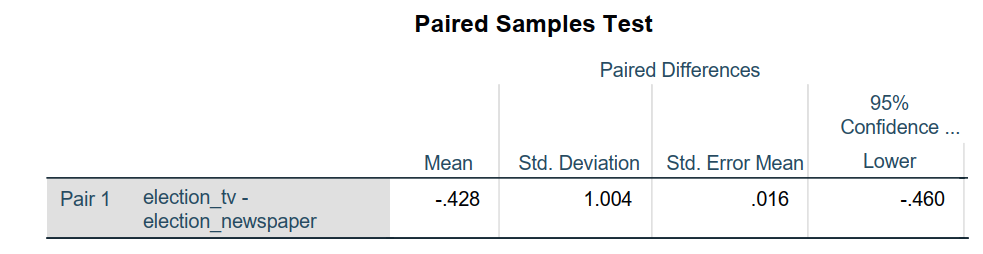
Check Sig. 2-tailed:
- If value of p is less than 0.05, we can conclude that there was a significant difference between the means of these two samples.
- If greater than 0.05, there is no significant difference.
In this example, the significance was 0.000, which is less than 0.05. We conclude that there is a significant difference between the means.