Lecture Slides
Video Lecture (from 2019)
Summary
We review an article which analyses newspaper coverage of eCigarettes. In reviewing this article, we illustrate thematic analysis of qualitative data.
Preparation
Take a moment to have a look at the article we are using as an example. You can access it by simply clicking the link built into the citation below.
Rooke, C., & Amos, A. (2014). News media representations of electronic cigarettes: an analysis of newspaper coverage in the UK and Scotland. Tobacco Control, 23(6), 507-512. PDF @ Academia.edu, PDF @ MQ Multisearch, PDF @ BMJ
How to read an article
As a researcher, the way I suggest you read an article is:
- Read the abstract, focusing on identifying (1) the research question; (2) the dataset; (3) the method of analysis; and (4) the findings
- Flip to the results, looking at (1) the key subheadings (themes) and (2) any tables or charts.
- Flip back to the Methods section and clarify the meaning of any of the parts of the abstract or results that don’t make sense to you (e.g. “How did they select the sample or data?” or “How did they measure XXX?”)
Research question
The research question for this paper is straight forward: How does the news media represent eCigarettes?
The topic is important because of (1) their rising popularity; (2) the potential for them to be less harmful that smoking tobacco, and (3) the issues they raise for governments who regulate them.
The data
The dataset for the paper is 15 newspapers (12 print, 3 online) between 2007 and 2012.
The authors found these by using the search terms ‘electronic cigarette’, ‘e-cigarette’ and ‘e cigarette’ in an electronic database (Lexis) and also through searching for the terms on the three online newspaper sites.
They found 119 articles in total.
The coding process
It is worth reading the last two paragraph of the Methods section of this paper closely. I’ve pasted these two paragraphs below. I’ve also bolded key words which illustrate key concepts in qualitative analysis
The thematic analysis was an iterative process involving rereading and coding the articles, generating themes and discussing the coding and themes between the authors. As ENDS are an emergent topic, the initial coding progressed inductively. Articles were read, reread, and then coded focusing on the following questions: What were ENDS presented as being for? What characteristics of ENDS were emphasised? Who were presented as actual/potential users of ENDS? Where was use of ENDS portrayed/imagined? This initial coding was then organised into key ways of presenting ENDS which recurred throughout the coverage. These were refined through further coding and discussion to produce five key themes (box 1). A theme, following Braun and Clarke ‘captures something important about the data in relation to the research question, and represents some level of patterned response or meaning within the data set’. All articles were then coded for the presence of the five themes. There could be multiple themes in one article, and a theme did not have to be the central focus of the article to be deemed present. An indication of the prevalence of themes is provided in the Results (table 1) in order to give a sense of how their presence in articles varied over time. Thirteen articles did not contain any of the five key themes. These articles fell into two main categories: brief reports on surveys sponsored by an ENDS retailer or stories whose main focus was not ENDS.
CR led the analysis, regularly discussing the development and refining of themes with AA. Articles were then coded for presence of themes by CR. To check coding reliability, 19% (23) of the articles selected using a random number generator, were also coded by AA using the definitions in the box. Cohen’s kappa for the five themes ranged from 0.86 to 1 indicating a good level of agreement for all themes. Illustrative quotes from articles are given in the Results with the source, date and page number for newspapers.
Issues to note
- When the authors say “thematic analysis was an iterative process” and that “initial coding progressed inductively” they are stating that they did not start with a pre-existing theory or set of categories which they coded the data. Instead the thematic codes developed. From this we know that they start with open coding of the newspaper articles.
- When the authors say “refined through further coding and discussion to produce five key themes” and “All articles were then coded for the presence of the five themes” they are describing how at the end of their open coding they developed a codebook, and then engaged in axial coding.
- These authors present some of their results as quantitative data, which is described in the methods when they say that “prevalence of themes is provided in the Results (table 1).”
- The authors describe how they checked for intercoder reliability and ensured that their coding was reliable and valid when they describe “check coding reliability” and calculating the “Cohen’s kappa” (which is roughly speaking a form of correlation analysis - testing whether the results of the two coders were similar) Follow this link to read more on Cohen’s kappa and intercoder reliability
- The authors then describe how they engaged in selective coding to extract “Illustrative quotes” which are used to present the five qualitative themes in the Results section of the paper.
But what did they actually do?
But in simple terms, what did they actually do to analyse this data?
In the steps below, I’m going to pretend they analysed their data in Microsoft Word, and simulate what they might have done.
Step 1: The data
Their data would have been a series of newspaper articles, like this one:
Let’s pretend they use microsoft word, and in that case they would have pasted all their articles into one or more word documents.
Below we can see an example of the same article. On the left it is on the internet, viewed through a web browser. On the right is the same article in a Word document.

Figure 1: Newspaper article in Word document, next to same article on internet.
Step 2: Think
Before they started coding, they probably would have had a bit of the think about what themes they expected to find. We always have this expectation, even if we don’t write it down.
Let’s pretend they wrote it down. Perhaps it looked something like Figure 2.
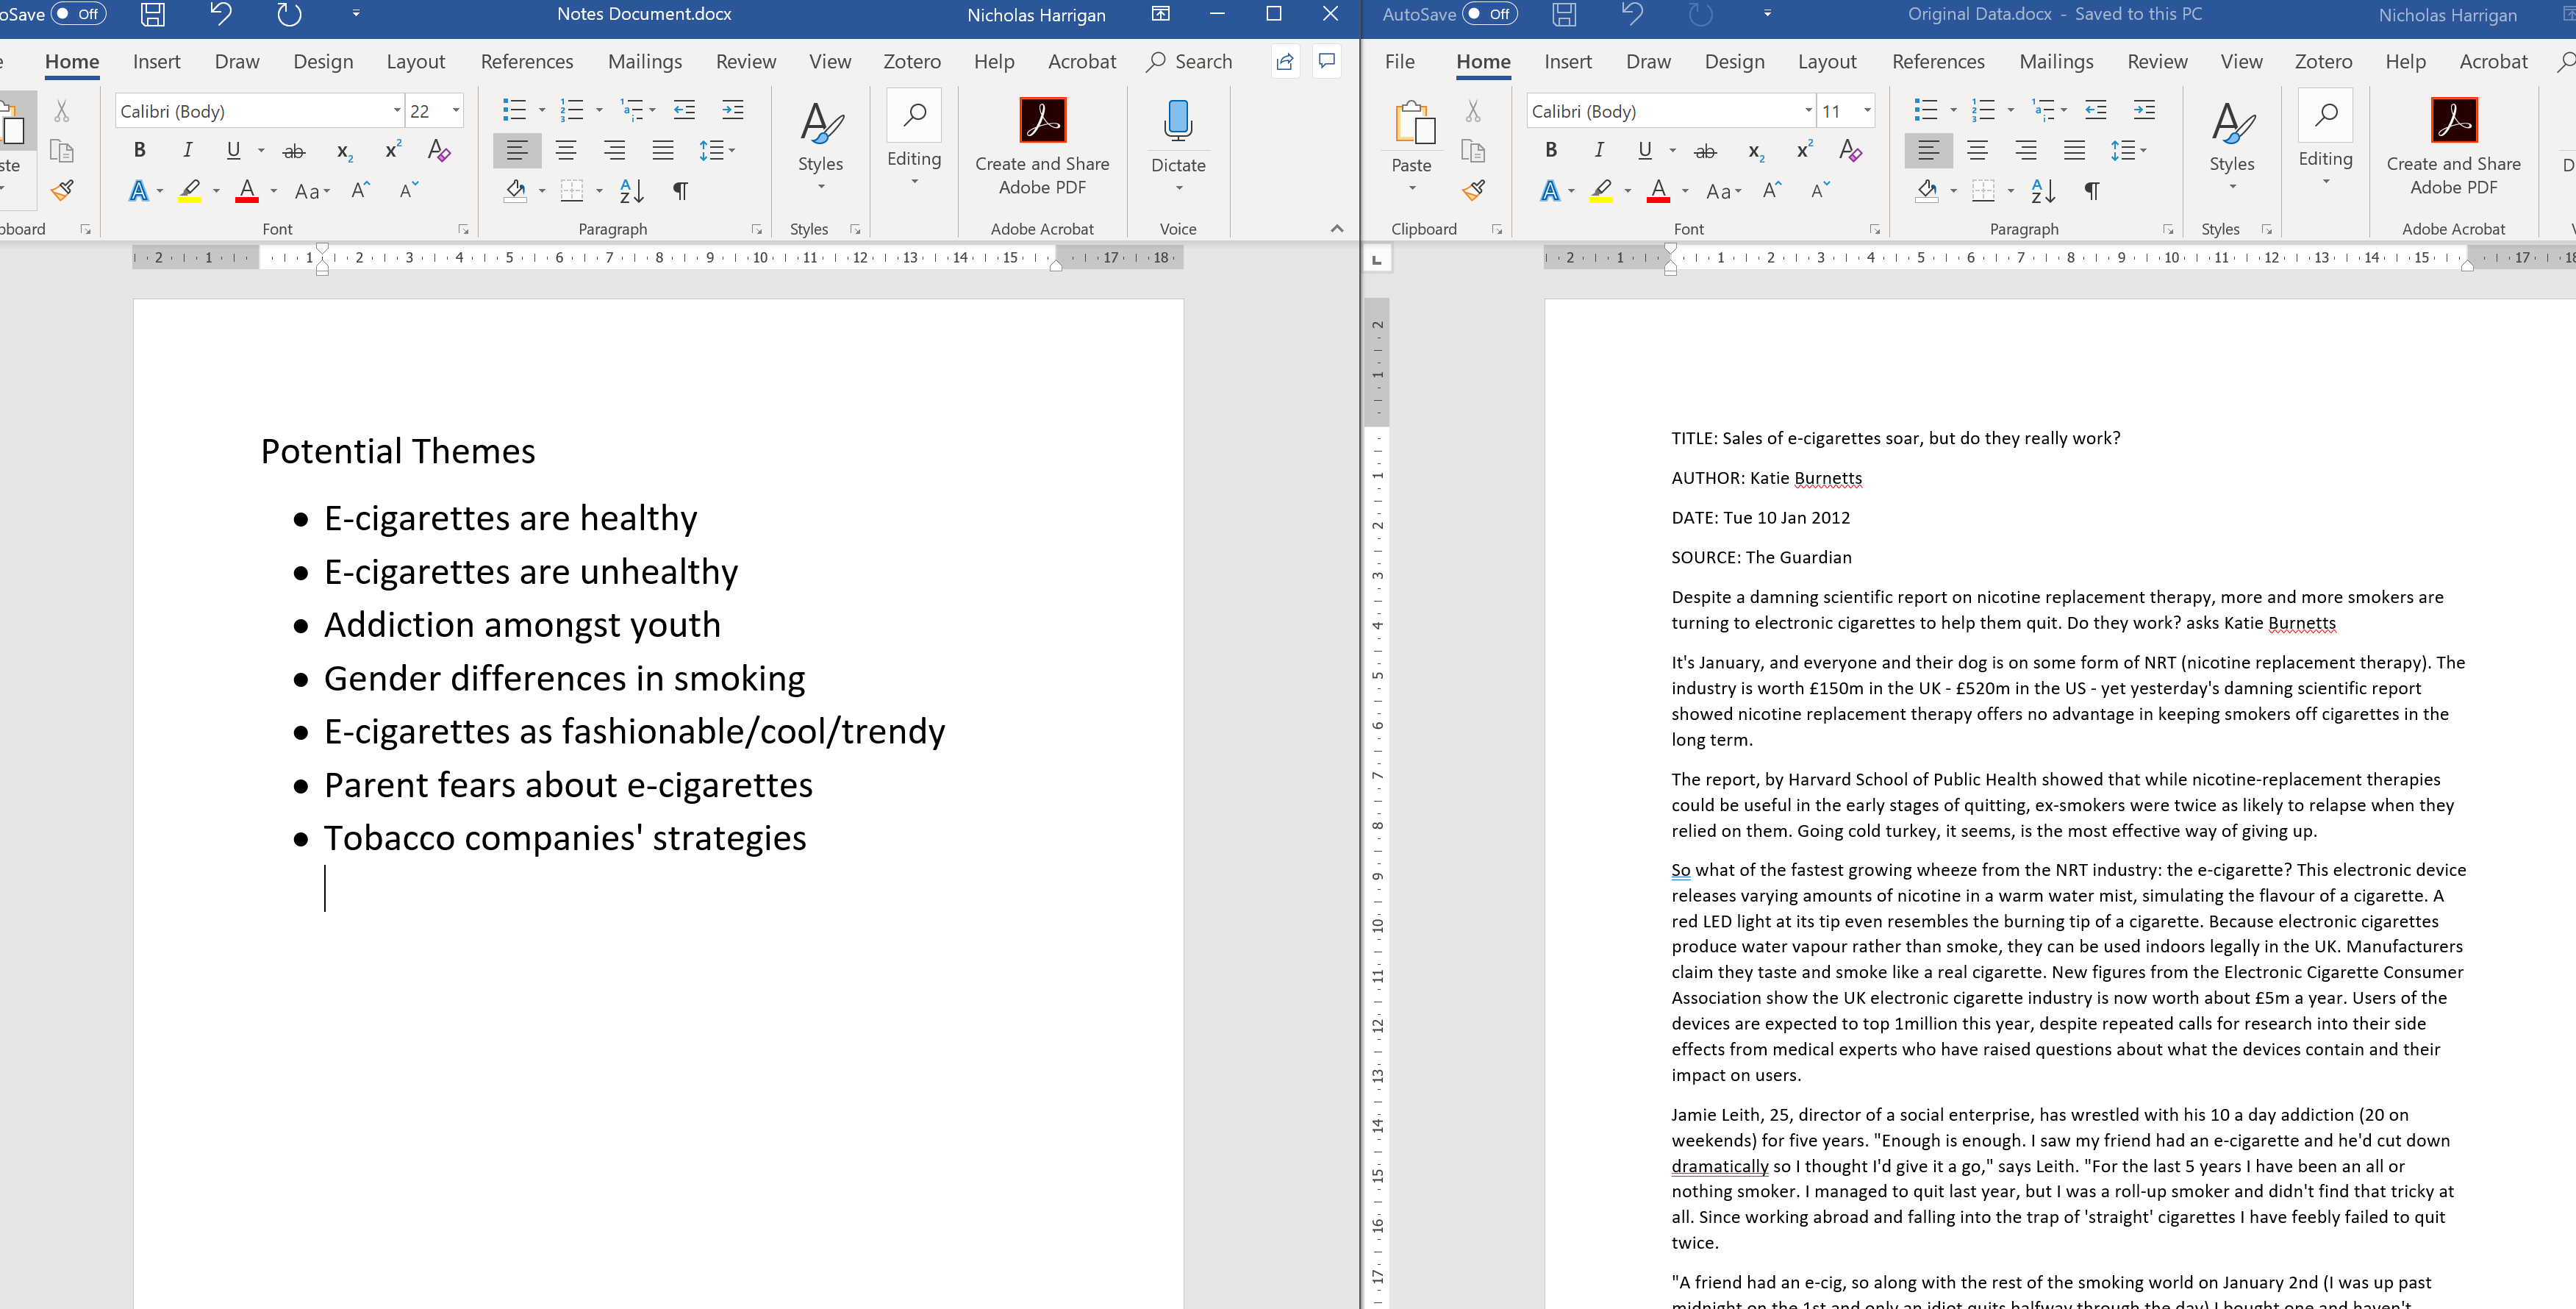
Figure 2: Themes we expect to find.
Step 3: Open coding + Analytical memo writing
They would have then started coding, perhaps it looked something like this when they did their initial coding of that article. Note that I’ve used the comment function in Microsoft Word, but I could have just used highlighting, underlying, or writing notes in the text (so long as it was clear what I was doing).
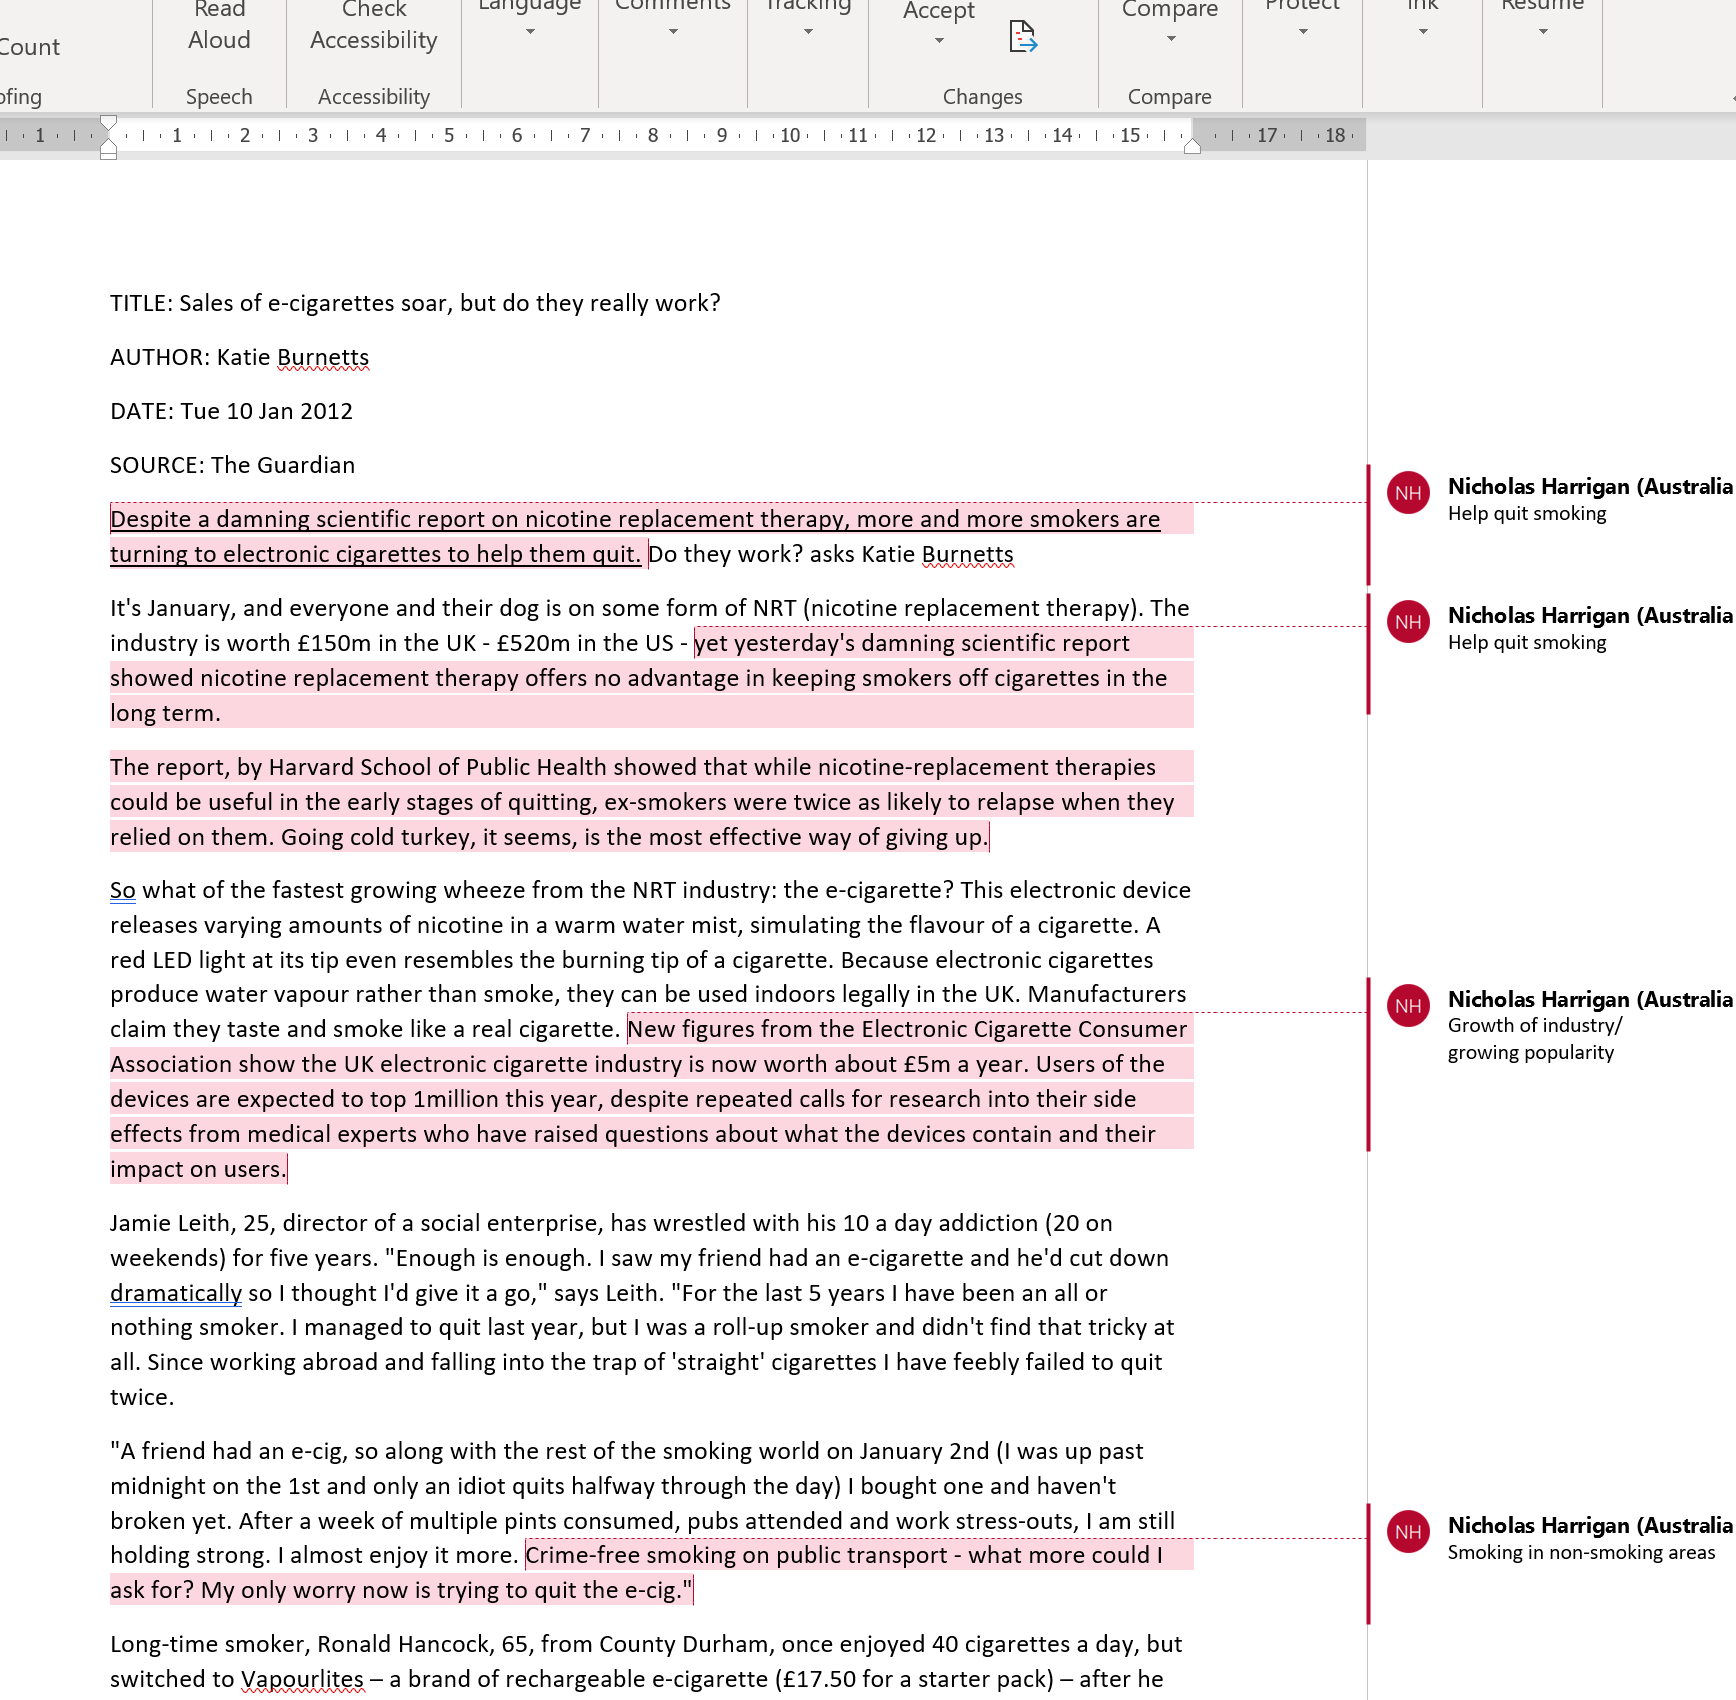
Figure 3: What there open coding might have looked like
Step 4: Debate themes, find argument
They probably had a few different ideas about what they could have eventually chosen as their final coding framework?
Perhaps their options looked like those in Figure 4, below. Note that these are hypothetical
Notice how the themes are related to the argument the authors are going to make in the paper.
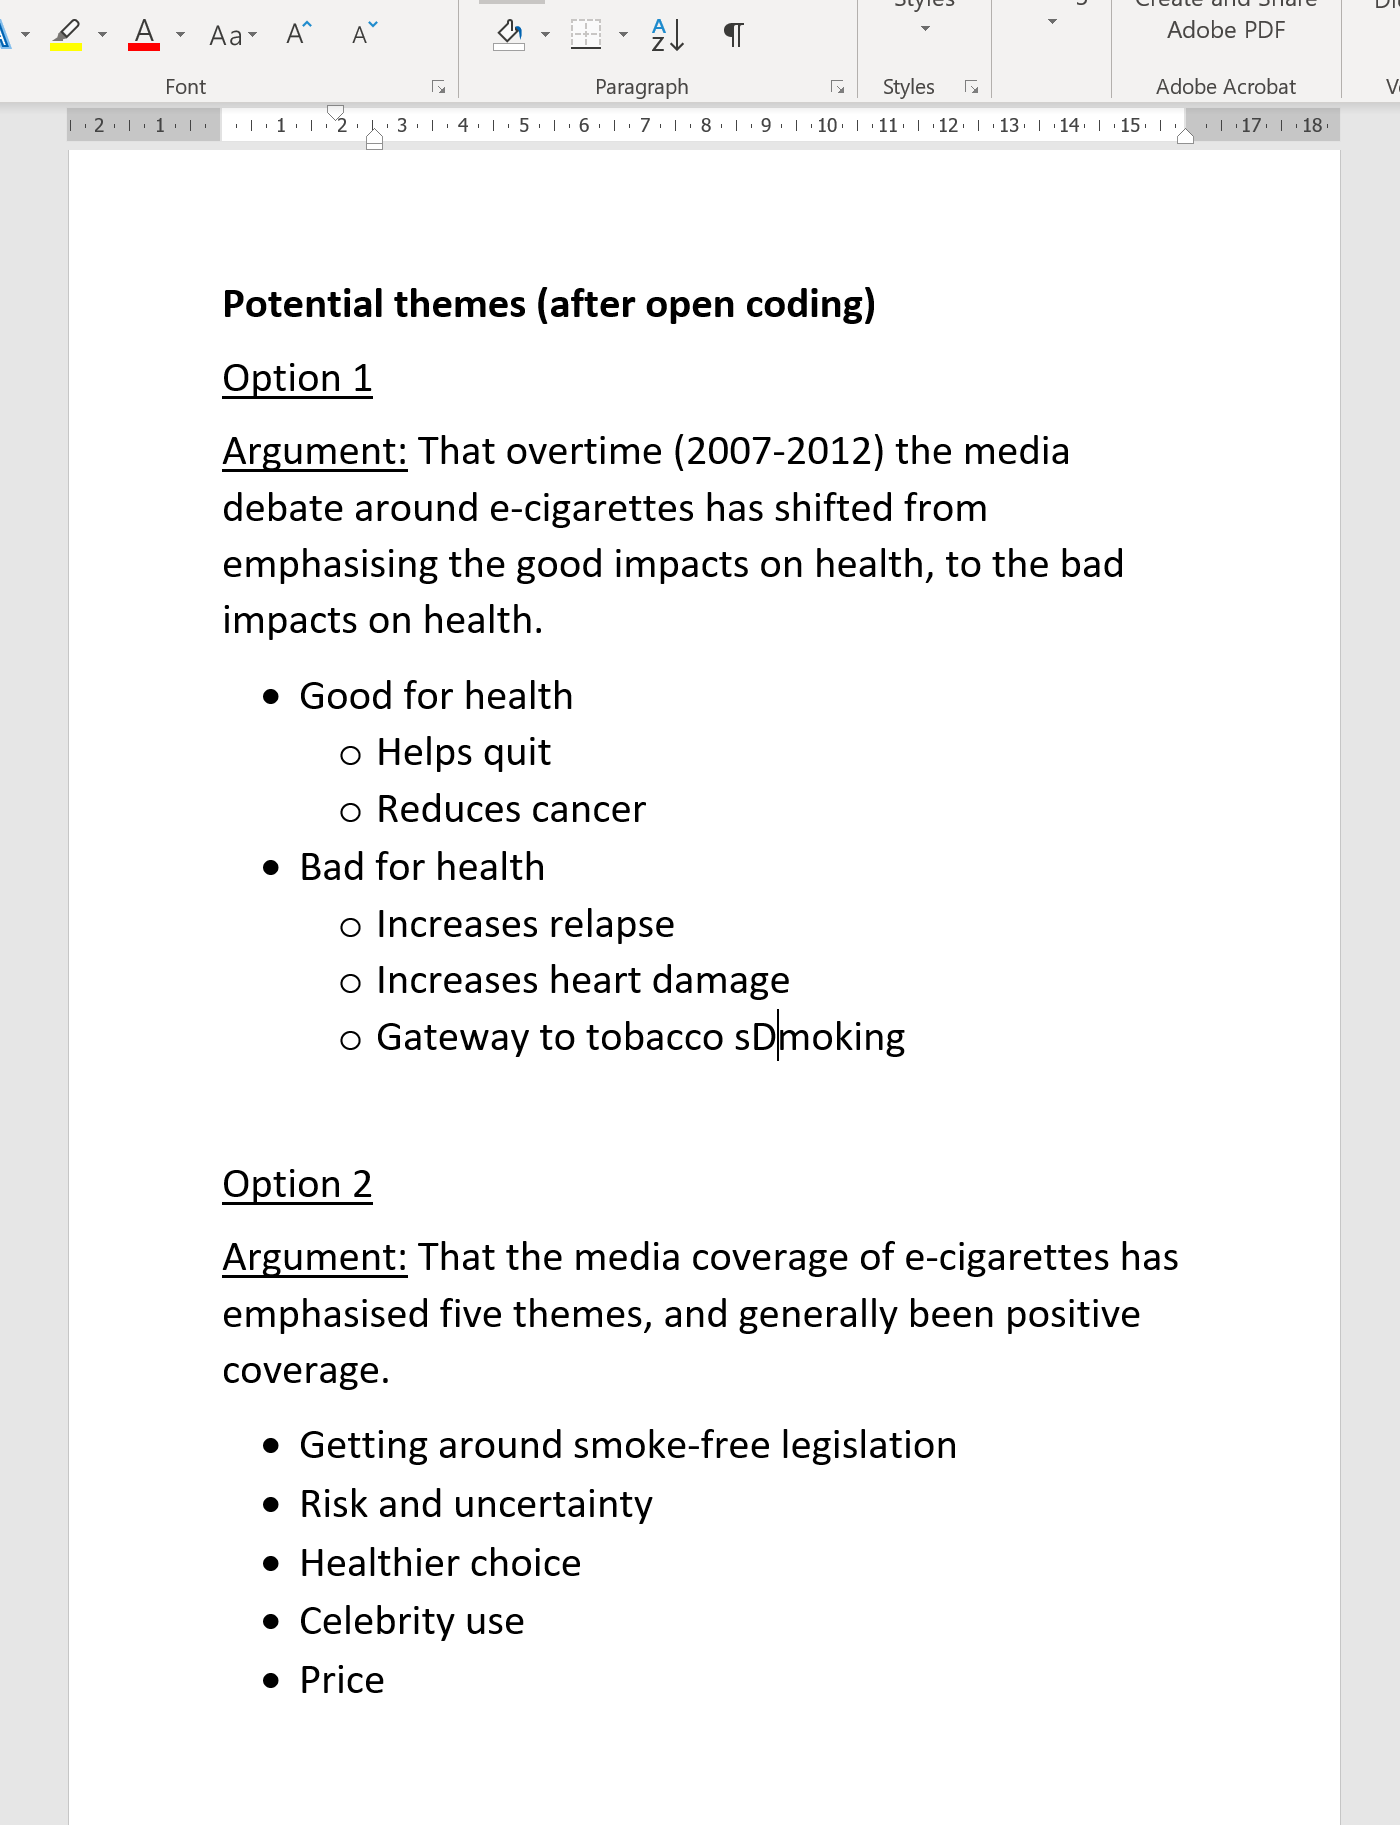
Figure 4: Two different hypothetical ways of framing the argument and themes of articles on e-cigarettes.
Step 5: Codebook
So they then probably developed a simple codebook.
Maybe it looked something like this.
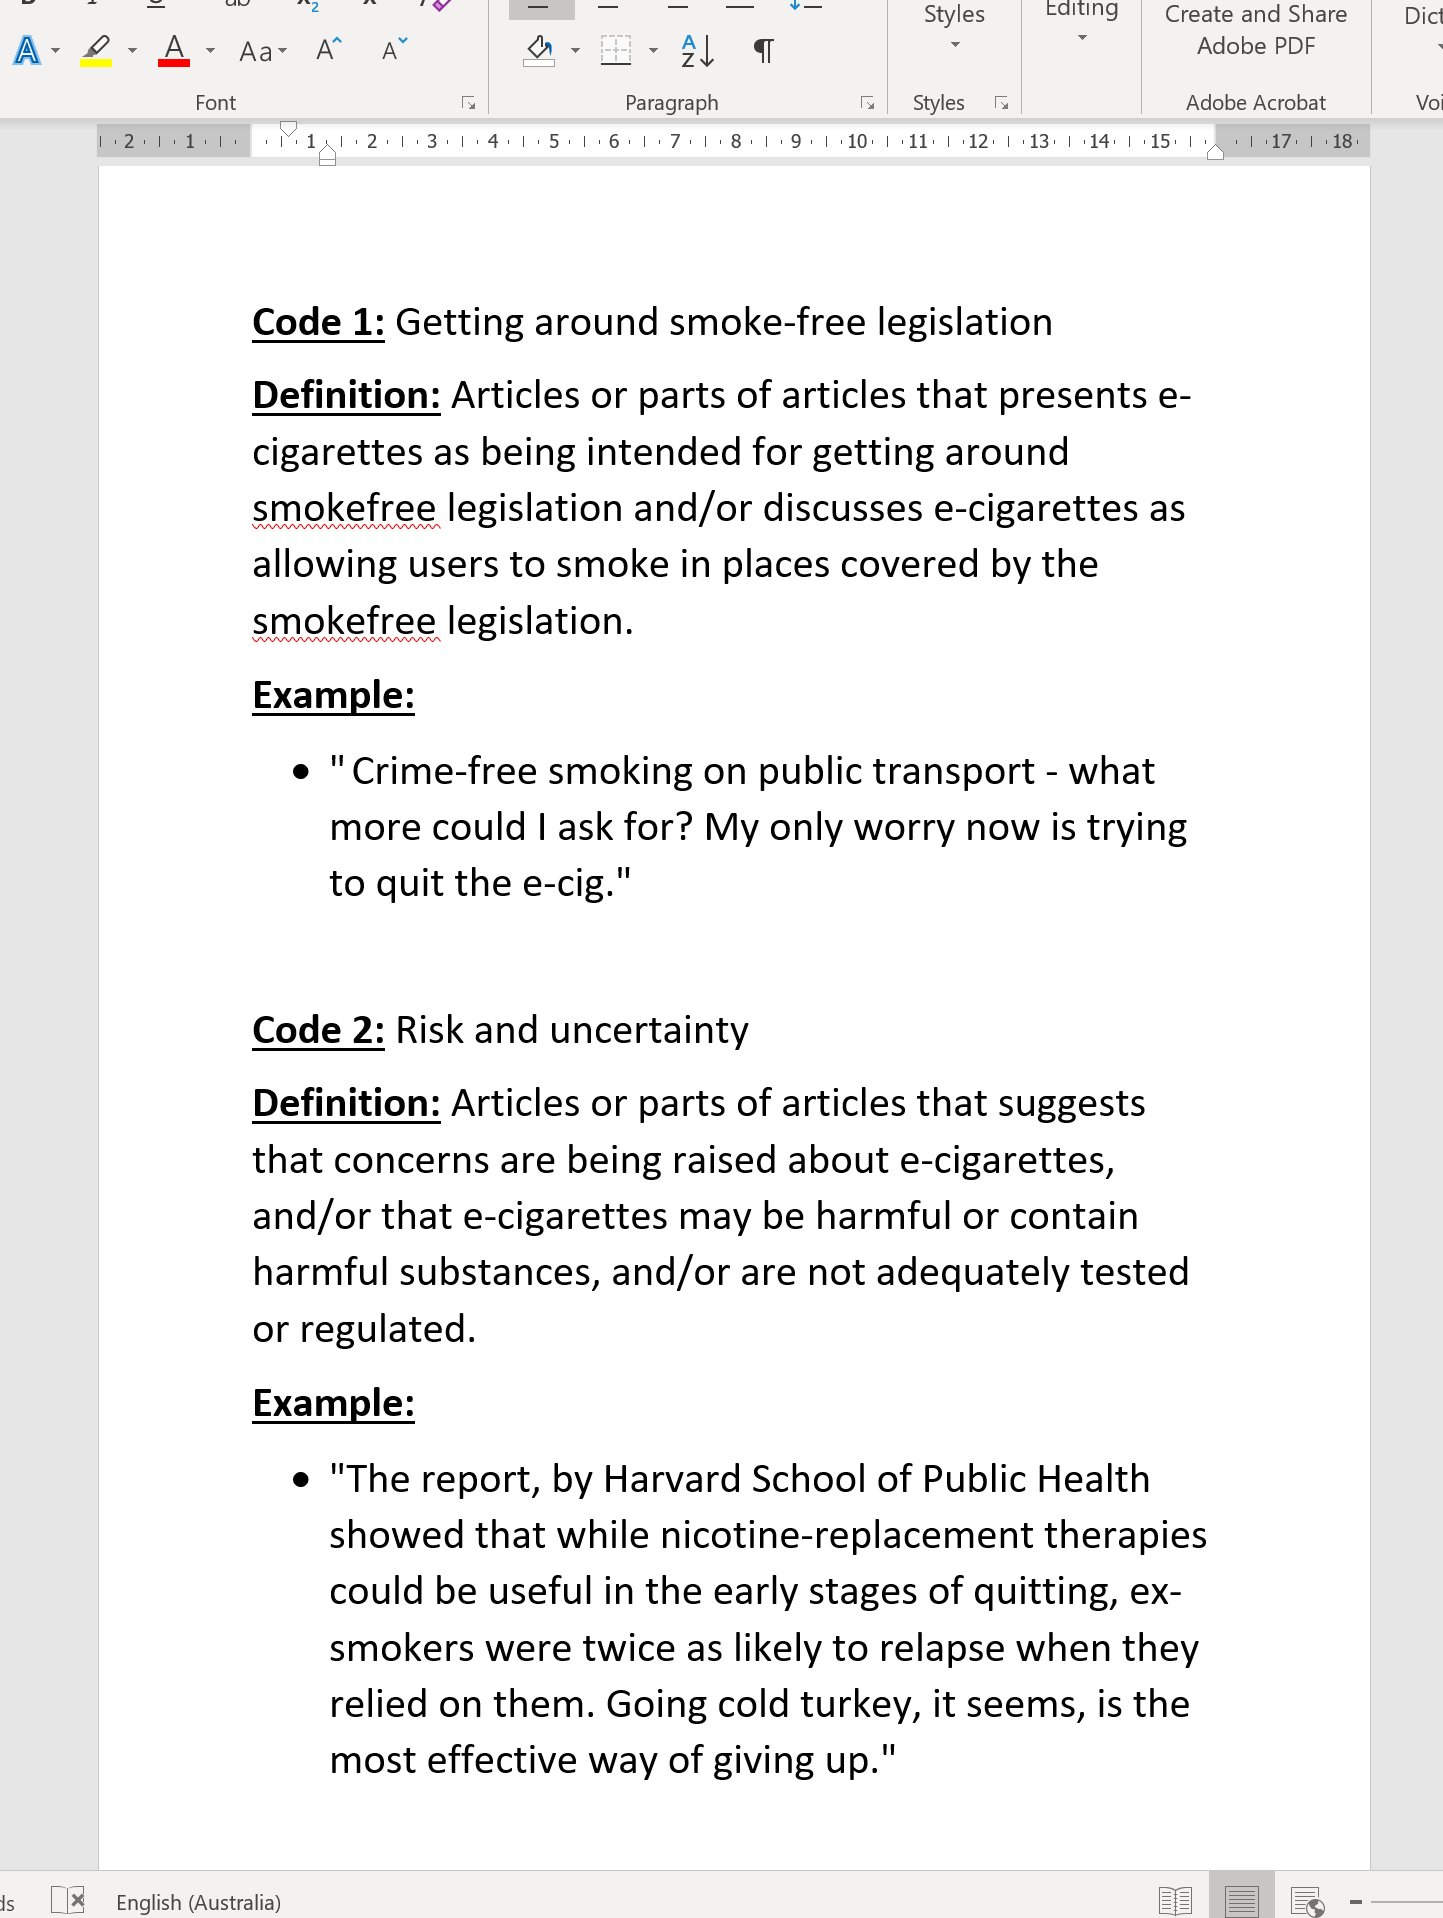
Figure 5: A page of a simple codebook
Step 6: Axial coding
They would have then gone through and done the axial coding: reviewing each of the 117 newspaper articles, and coding them according to the dominant themes, and extracting excerpts from each.
Perhaps their word document looked something like Figure 6. Note that I’ve substituted in filler text for each of the excerpts/quotes.
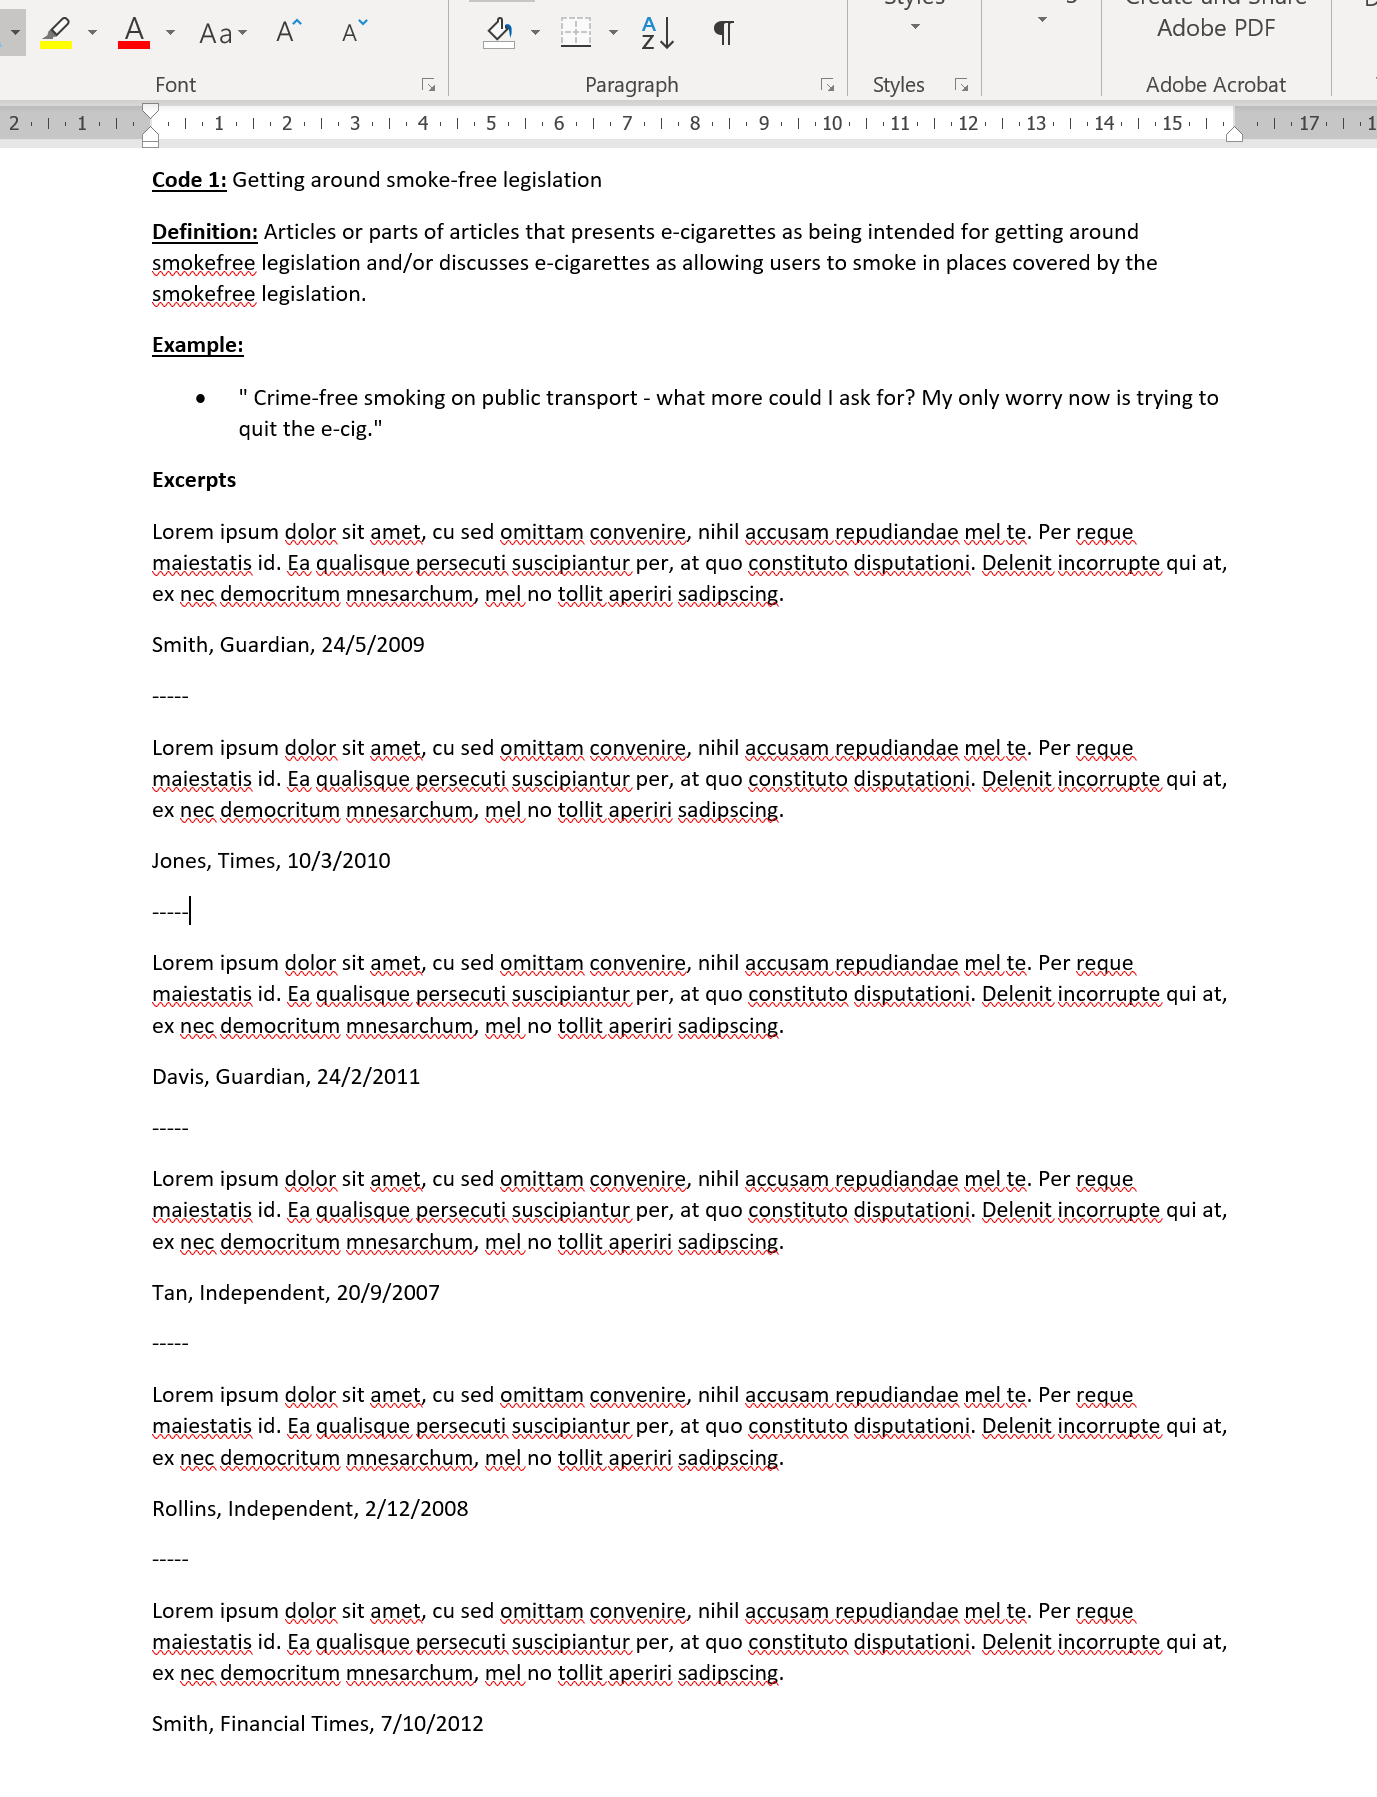
Figure 6: Axial coding
Step 7: Confirm argument & evidence
They probably then looked over what they found and confirmed that what they thought was there was there.
They may at this stage calculate intercoder reliability statistics
Step 8: Selective coding & write-up
They would have then gone and extracted their illustrative quotes (selective coding), and written them up. It ended up looking like the paragraph below in Figure 7
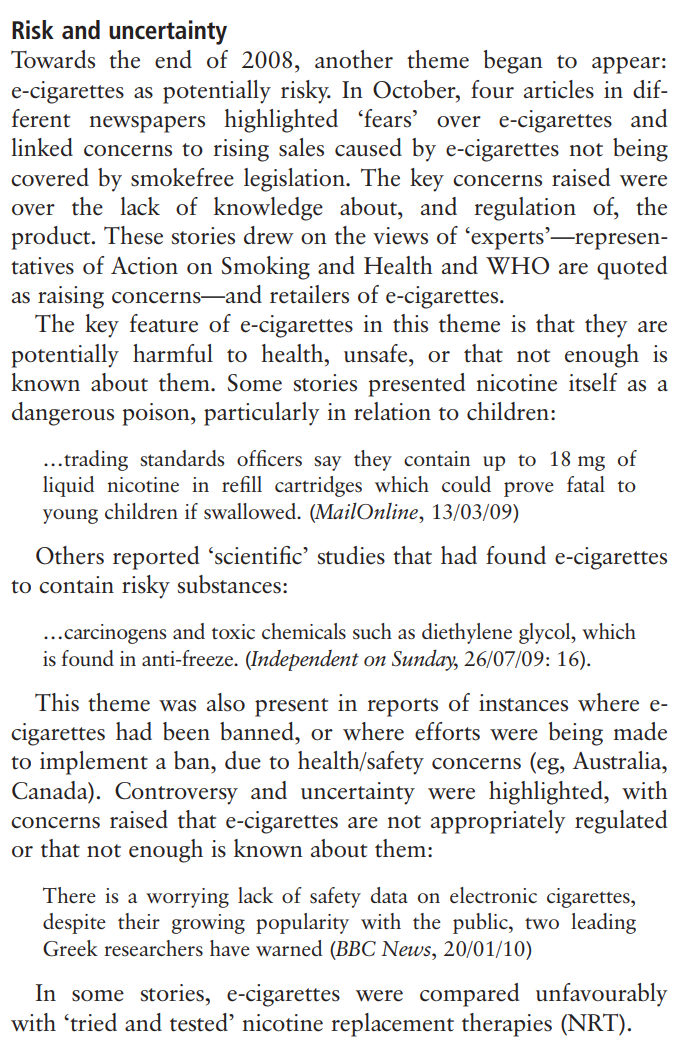
Figure 7: Writing up a theme with illustrative quotes and explanation.
Step 9: Tabulation
Lastly they would have tabulated the number of articles with each theme, by the year they were published. See the screenshot below of Figure 8 (Table 1 from the article).
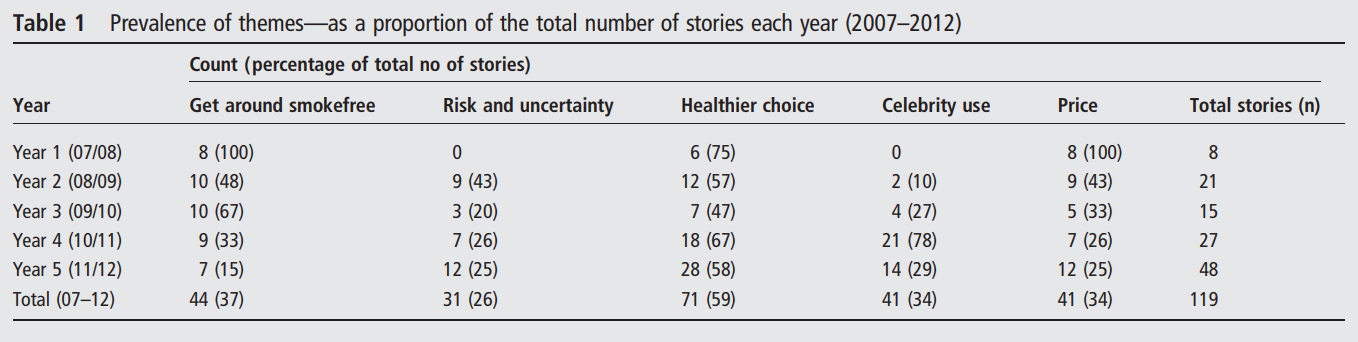
Figure 8: Example of quantitative presentation of themes as a table