This section introduces important interfaces of SPSS. SPSS has two tabs at the bottom, Data View and Variable View.
Data View
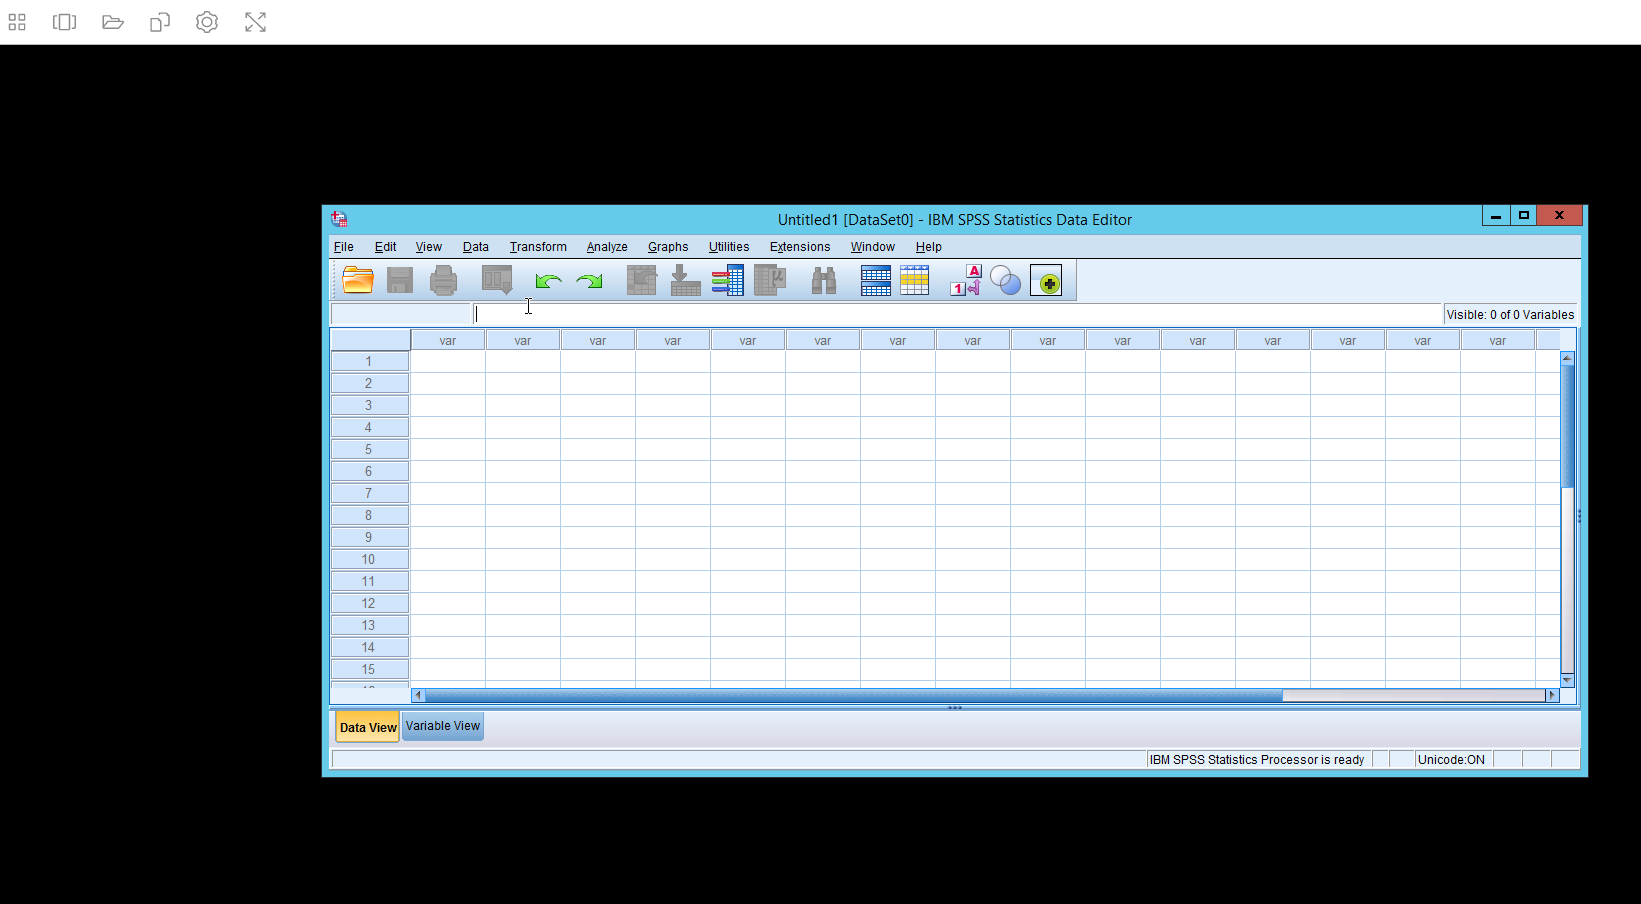
Click the Data View first.
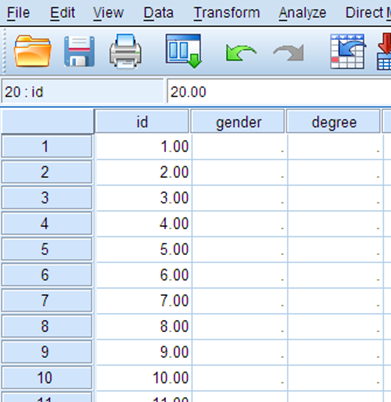
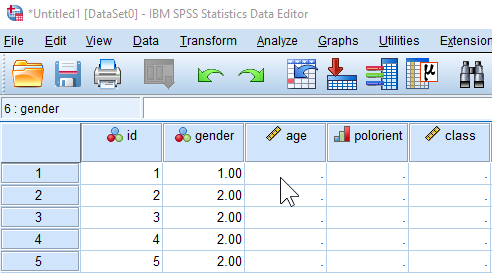
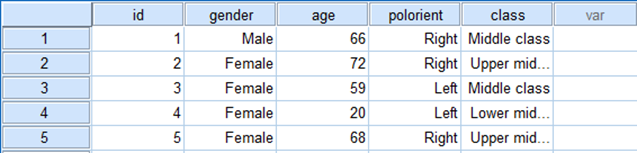
Data can be manually entered into the Data Editor (that you see in <Figure 2>), which may be useful for entering a small dataset or making a minor edit to a larger dataset.
To be familiarised with Data Editor, let’s manually enter a sub-sample of 30 respondents from the 2009 AuSSA (Australian Survey of Social Attitudes) using <table 1>. This table includes four variables: gender, age, political orientation and social class.
Note that <Table 1> does not have a variable of identification numbers –a unique number for each respondent– which is frequently used for identifying respondents. We will create a variable of identification numbers just like what professional researchers do.
The questionnaires used for this dataset are:
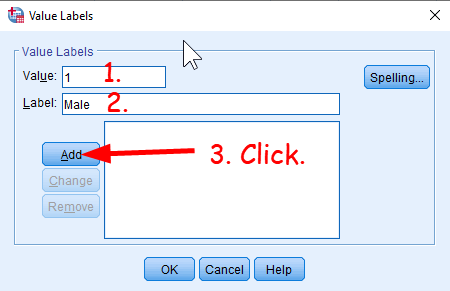
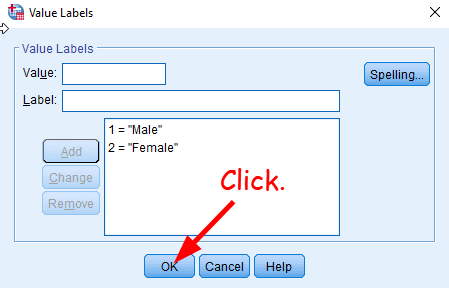
1. Firstly, are you …?
(1) Male
(2) Female
2. How old are you?
(________) years old
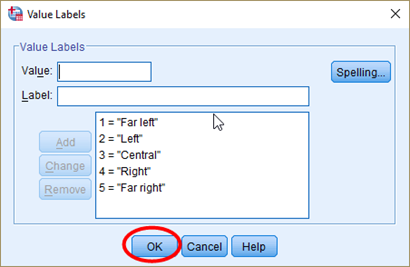
3. In politics, people often talk about left or right. Where would you put yourself among the following?
(1) Far left
(2) Left
(3) Center
(4) Right
(5) Far right
4. Most people see themselves as belonging to a particular class. Please tell me which social class you would say you belong to?
(1) Lower class
(2) Working class
(3) Lower middle class
(4) Middle class
(5) Upper middle class
(6) Upper class
Table 1: A Subsample of 30 Respondents from the 2009 AuSSA
|
Gender
|
Age
|
Political Orientation
|
Social Class
|
|
Male
|
66
|
Right
|
Middle class
|
|
Female
|
72
|
Right
|
Upper middle class
|
|
Female
|
59
|
Left
|
Middle class
|
|
Female
|
20
|
Left
|
Lower middle class
|
|
Female
|
68
|
Right
|
Upper middle class
|
|
Male
|
76
|
Right
|
Middle class
|
|
Male
|
61
|
Left
|
Upper middle class
|
|
Male
|
90
|
Right
|
Middle class
|
|
Female
|
64
|
Left
|
Lower middle class
|
|
Female
|
39
|
Left
|
Upper middle class
|
|
Male
|
57
|
Right
|
Middle class
|
|
Male
|
47
|
Left
|
Lower class
|
|
Female
|
56
|
Left
|
Middle class
|
|
Female
|
51
|
Left
|
Middle class
|
|
Male
|
34
|
Left
|
Working class
|
|
Male
|
18
|
Center
|
Middle class
|
|
Female
|
18
|
Left
|
Working class
|
|
Female
|
30
|
Left
|
Upper middle class
|
|
Female
|
65
|
Right
|
Middle class
|
|
Male
|
35
|
Right
|
Middle class
|
|
Female
|
44
|
Right
|
Upper class
|
|
Female
|
40
|
Right
|
Middle class
|
|
Male
|
57
|
Left
|
Upper middle class
|
|
Male
|
40
|
Left
|
Lower middle class
|
|
Female
|
59
|
Left
|
Middle class
|
|
Female
|
82
|
Right
|
Middle class
|
|
Female
|
44
|
Far right
|
Working class
|
|
Female
|
30
|
Left
|
Middle class
|
|
Male
|
77
|
Left
|
Working class
|
|
Female
|
60
|
Right
|
Lower middle class
|
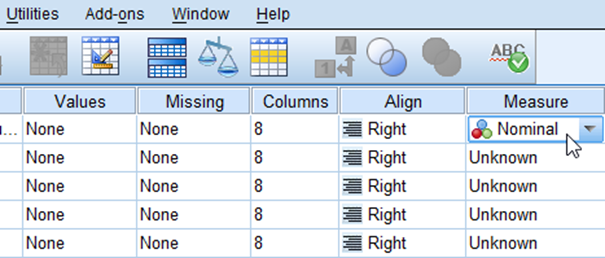
Do you remember that survey data are number-based data. If you look at <Table 1>, you will see text information in the variable of gender, political orientation, and social class. Instead of providing text information to SPSS, we will enter numeric values that correspond to text information in the Data Editor. Thus, your final data will look like <Table 2>. The next section will provide more details. Thus, DO NOT start entering data in <Table 2> at this time. Please see Variable View and How to enter data in the below. It will tell you how to enter data.
Table 2: A Dataframe of 30 Respondents from the 2009 Aussa
|
id
|
sex
|
age
|
polorient
|
class
|
|
1
|
1
|
66
|
4
|
4
|
|
2
|
2
|
72
|
4
|
5
|
|
3
|
2
|
59
|
2
|
4
|
|
4
|
2
|
20
|
2
|
3
|
|
5
|
2
|
68
|
4
|
5
|
|
6
|
1
|
76
|
4
|
4
|
|
7
|
1
|
61
|
2
|
5
|
|
8
|
1
|
90
|
4
|
4
|
|
9
|
2
|
64
|
2
|
3
|
|
10
|
2
|
39
|
2
|
5
|
|
11
|
1
|
57
|
4
|
4
|
|
12
|
1
|
47
|
2
|
1
|
|
13
|
2
|
56
|
2
|
4
|
|
14
|
2
|
51
|
2
|
4
|
|
15
|
1
|
34
|
2
|
2
|
|
16
|
1
|
18
|
3
|
4
|
|
17
|
2
|
18
|
2
|
2
|
|
18
|
2
|
30
|
2
|
5
|
|
19
|
2
|
65
|
4
|
4
|
|
20
|
1
|
35
|
4
|
4
|
|
21
|
2
|
44
|
4
|
6
|
|
22
|
2
|
40
|
4
|
4
|
|
23
|
1
|
57
|
2
|
5
|
|
24
|
1
|
40
|
2
|
3
|
|
25
|
2
|
59
|
2
|
4
|
|
26
|
2
|
82
|
4
|
4
|
|
27
|
2
|
44
|
5
|
2
|
|
28
|
2
|
30
|
2
|
4
|
|
29
|
1
|
77
|
2
|
2
|
|
30
|
2
|
60
|
4
|
3
|
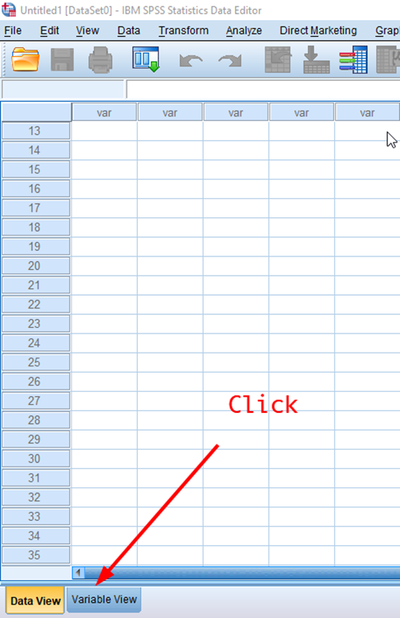
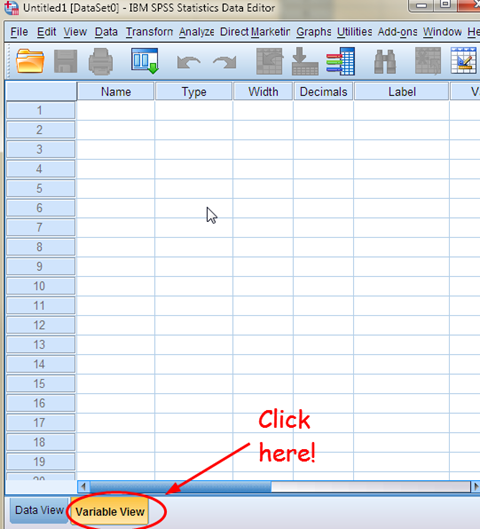
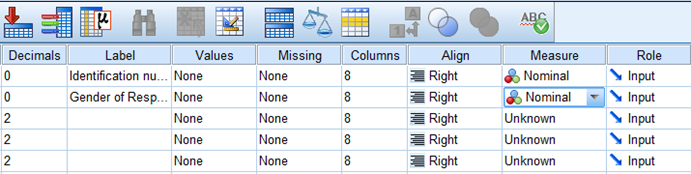
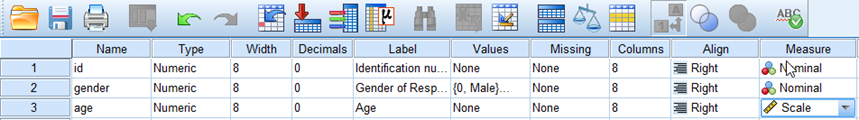
Variable View
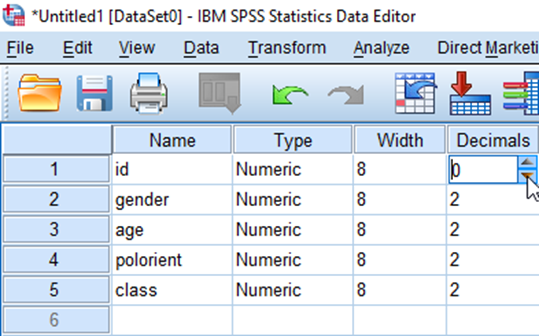
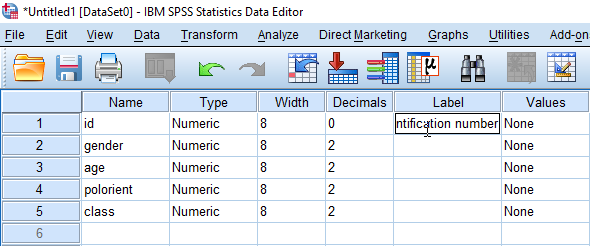
Click the Variable View at the bottom. In this spreadsheet, you need to provide information on variables in the dataset. <Table 1> has four variables, and we will add a variable of identification number (named id). Thus, we will input information on five variables: id, gender, age, political orientation and social class.
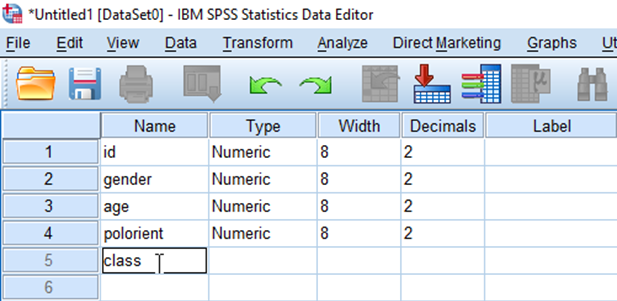
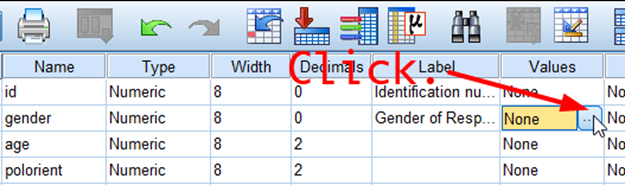
Let’s start entering the name of variables. The name of the variable is used to refer to that variable when you analyse data. Thus, a short variable name would make your data analysis easier. Also, variable names must be unique in the dataset. The same name can’t be assigned to more than one variable. White spaces are not allowed for variable names. Instead, you can use an “underscore(_)” or “period(.)”.
- In the first row of the first column, type id, which is the variable name of identification numbers.
- In the second row, type gender, which is the variable name of gender.
- In the third row, type age, which is the variable name of age.
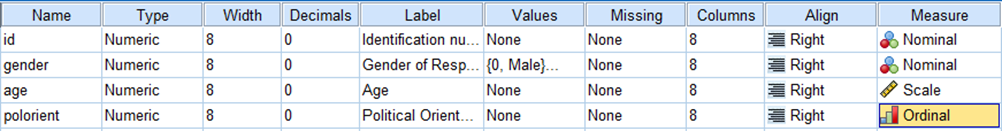
- In the fourth row, type polorient, which is the variable name of political orientation.
- In the fifth row, type class, which is the variable name of social class.
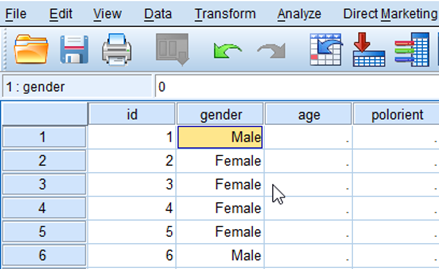
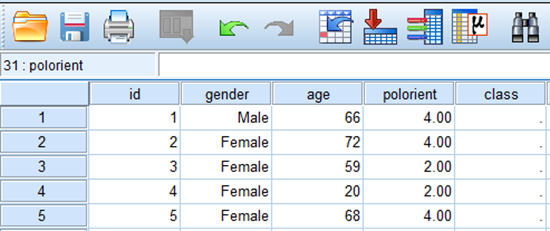
Next, Click the Data View again to enter the value of variables. You will see the variable names you just typed at the top of the spreadsheet.