- 3. Introduction to path analysis
- 3.1 Example/Provocation
- 3.2 Intro to the main causal pathways
- 3.3 Rules and advice for doing path analysis
- 1. Logic, theory, and assumptions determine direction of arrows.
- 2. Arrows can (normally) only go in one direction
- 3. Cycles are (normally) not allowed
- 4. Variables with arrow pointing at them are dependent variables in a regression model
- 5. Interaction effects are arrow pointing in middle of another arrow
- 6. Diagram type 1: all potential relationships
- 6. Diagram type 2: statistically significant relationships
- 3.4 An example
3. Introduction to path analysis
3.1 Example/Provocation
Path Analysis is an extension of regression modelling, where we attempt to estimate the magnitudes and the significance of a range of causal pathways between different variables.
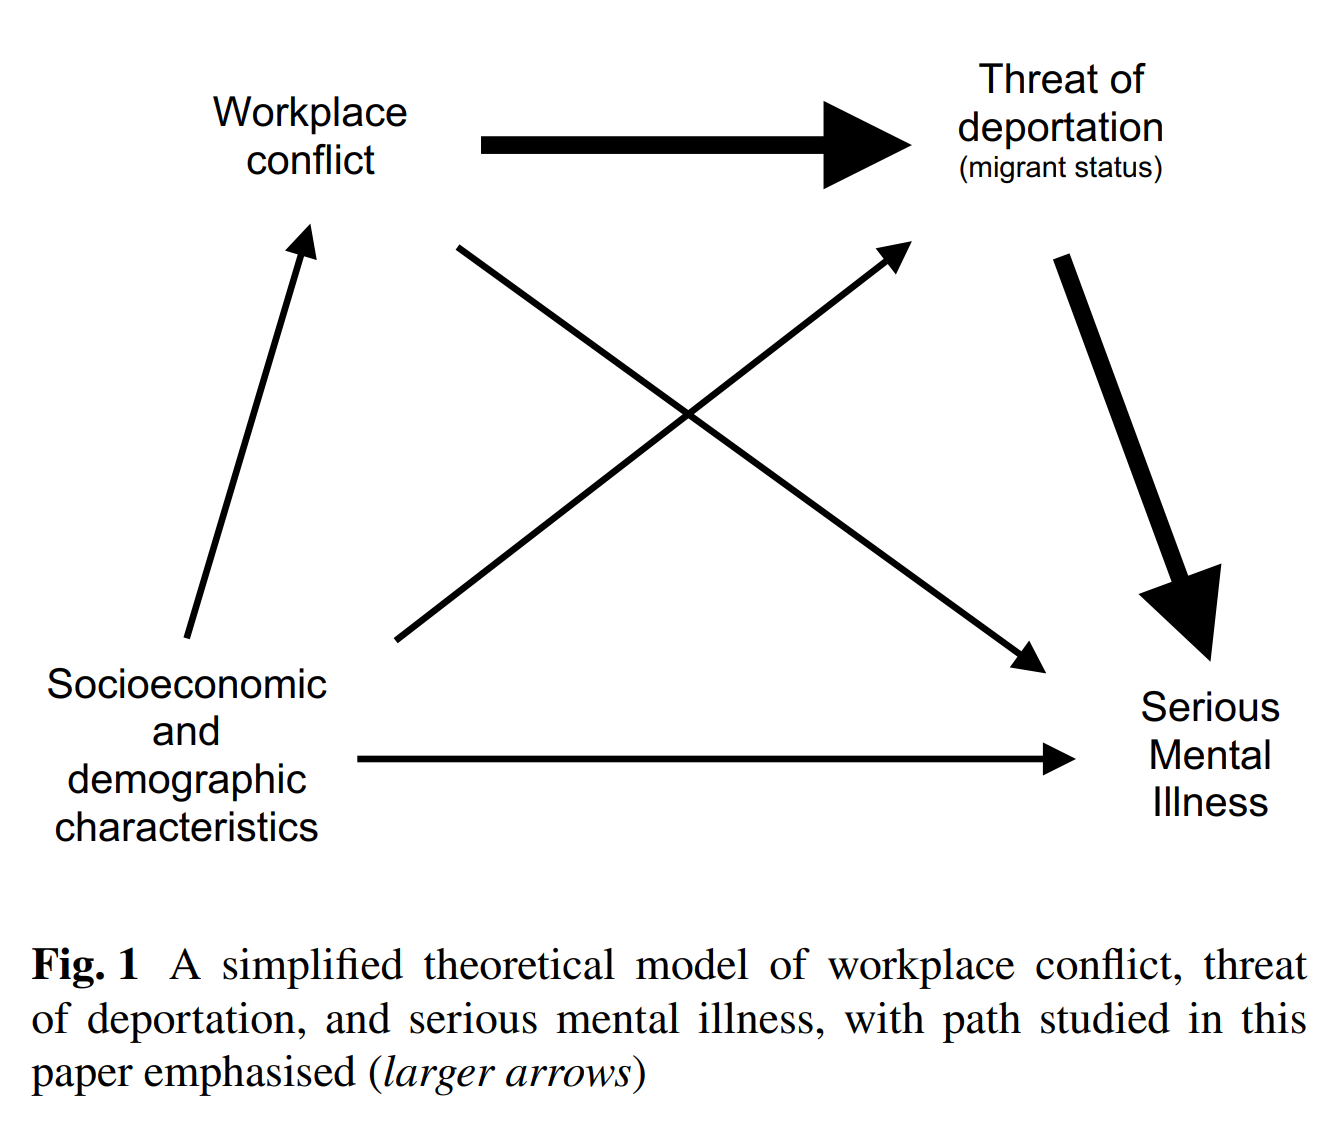
In the sample paper, take a look at Figure 1 on page 2, and then Figure 2 on page 7.
Figure 1 is a path diagram at the conceptual (or theoretical) level. The variables are simply key concepts, with hypothesised pathways represented by the arrows.
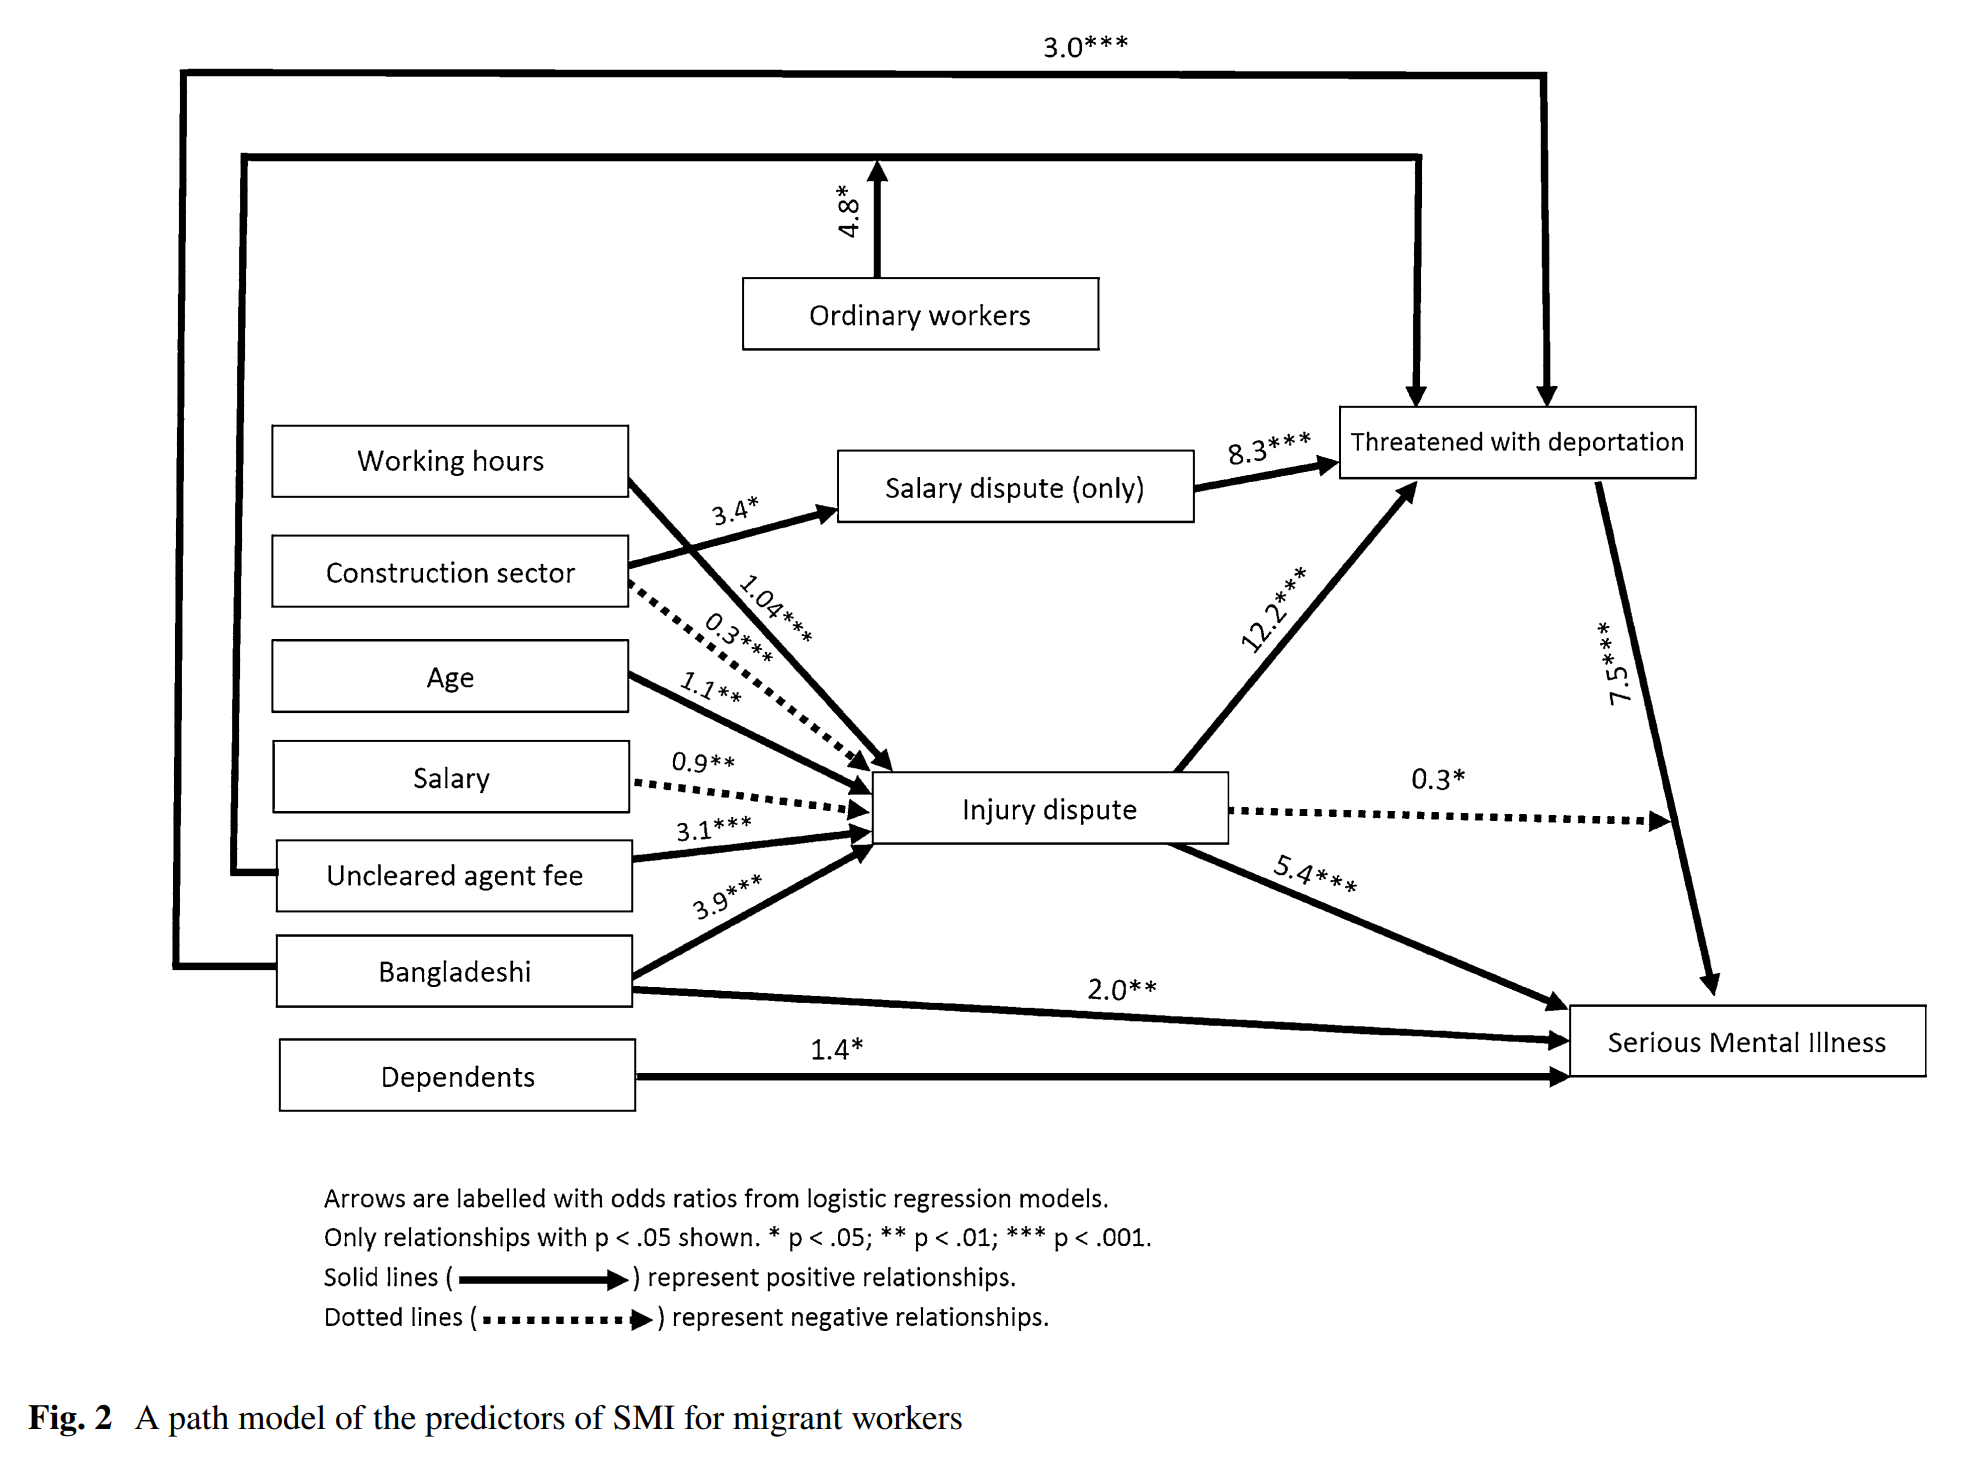
Take a look at Figure 2. This is the final path diagram for the models presented in Table 2.
- What do the arrows represent?
- What do the numbers represent?
- What does it mean when an arrow is solid or dotted?
- Why are there not arrows between all the boxes?
- What does it mean when an arrow points to the middle of another arrow? (such as ordinary workers and the arrow from uncleared agent fees to threatened with deportation)
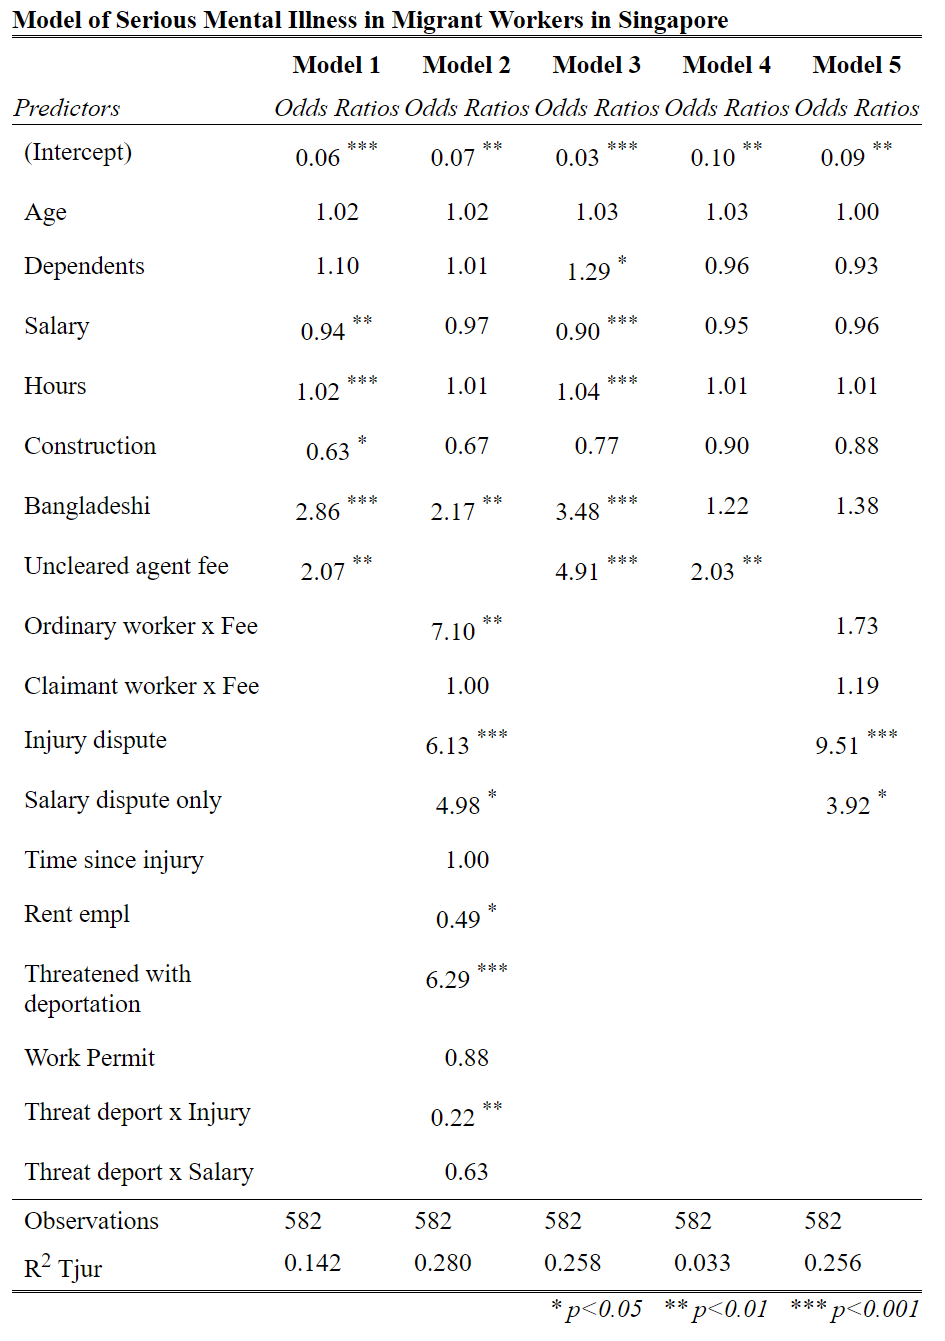
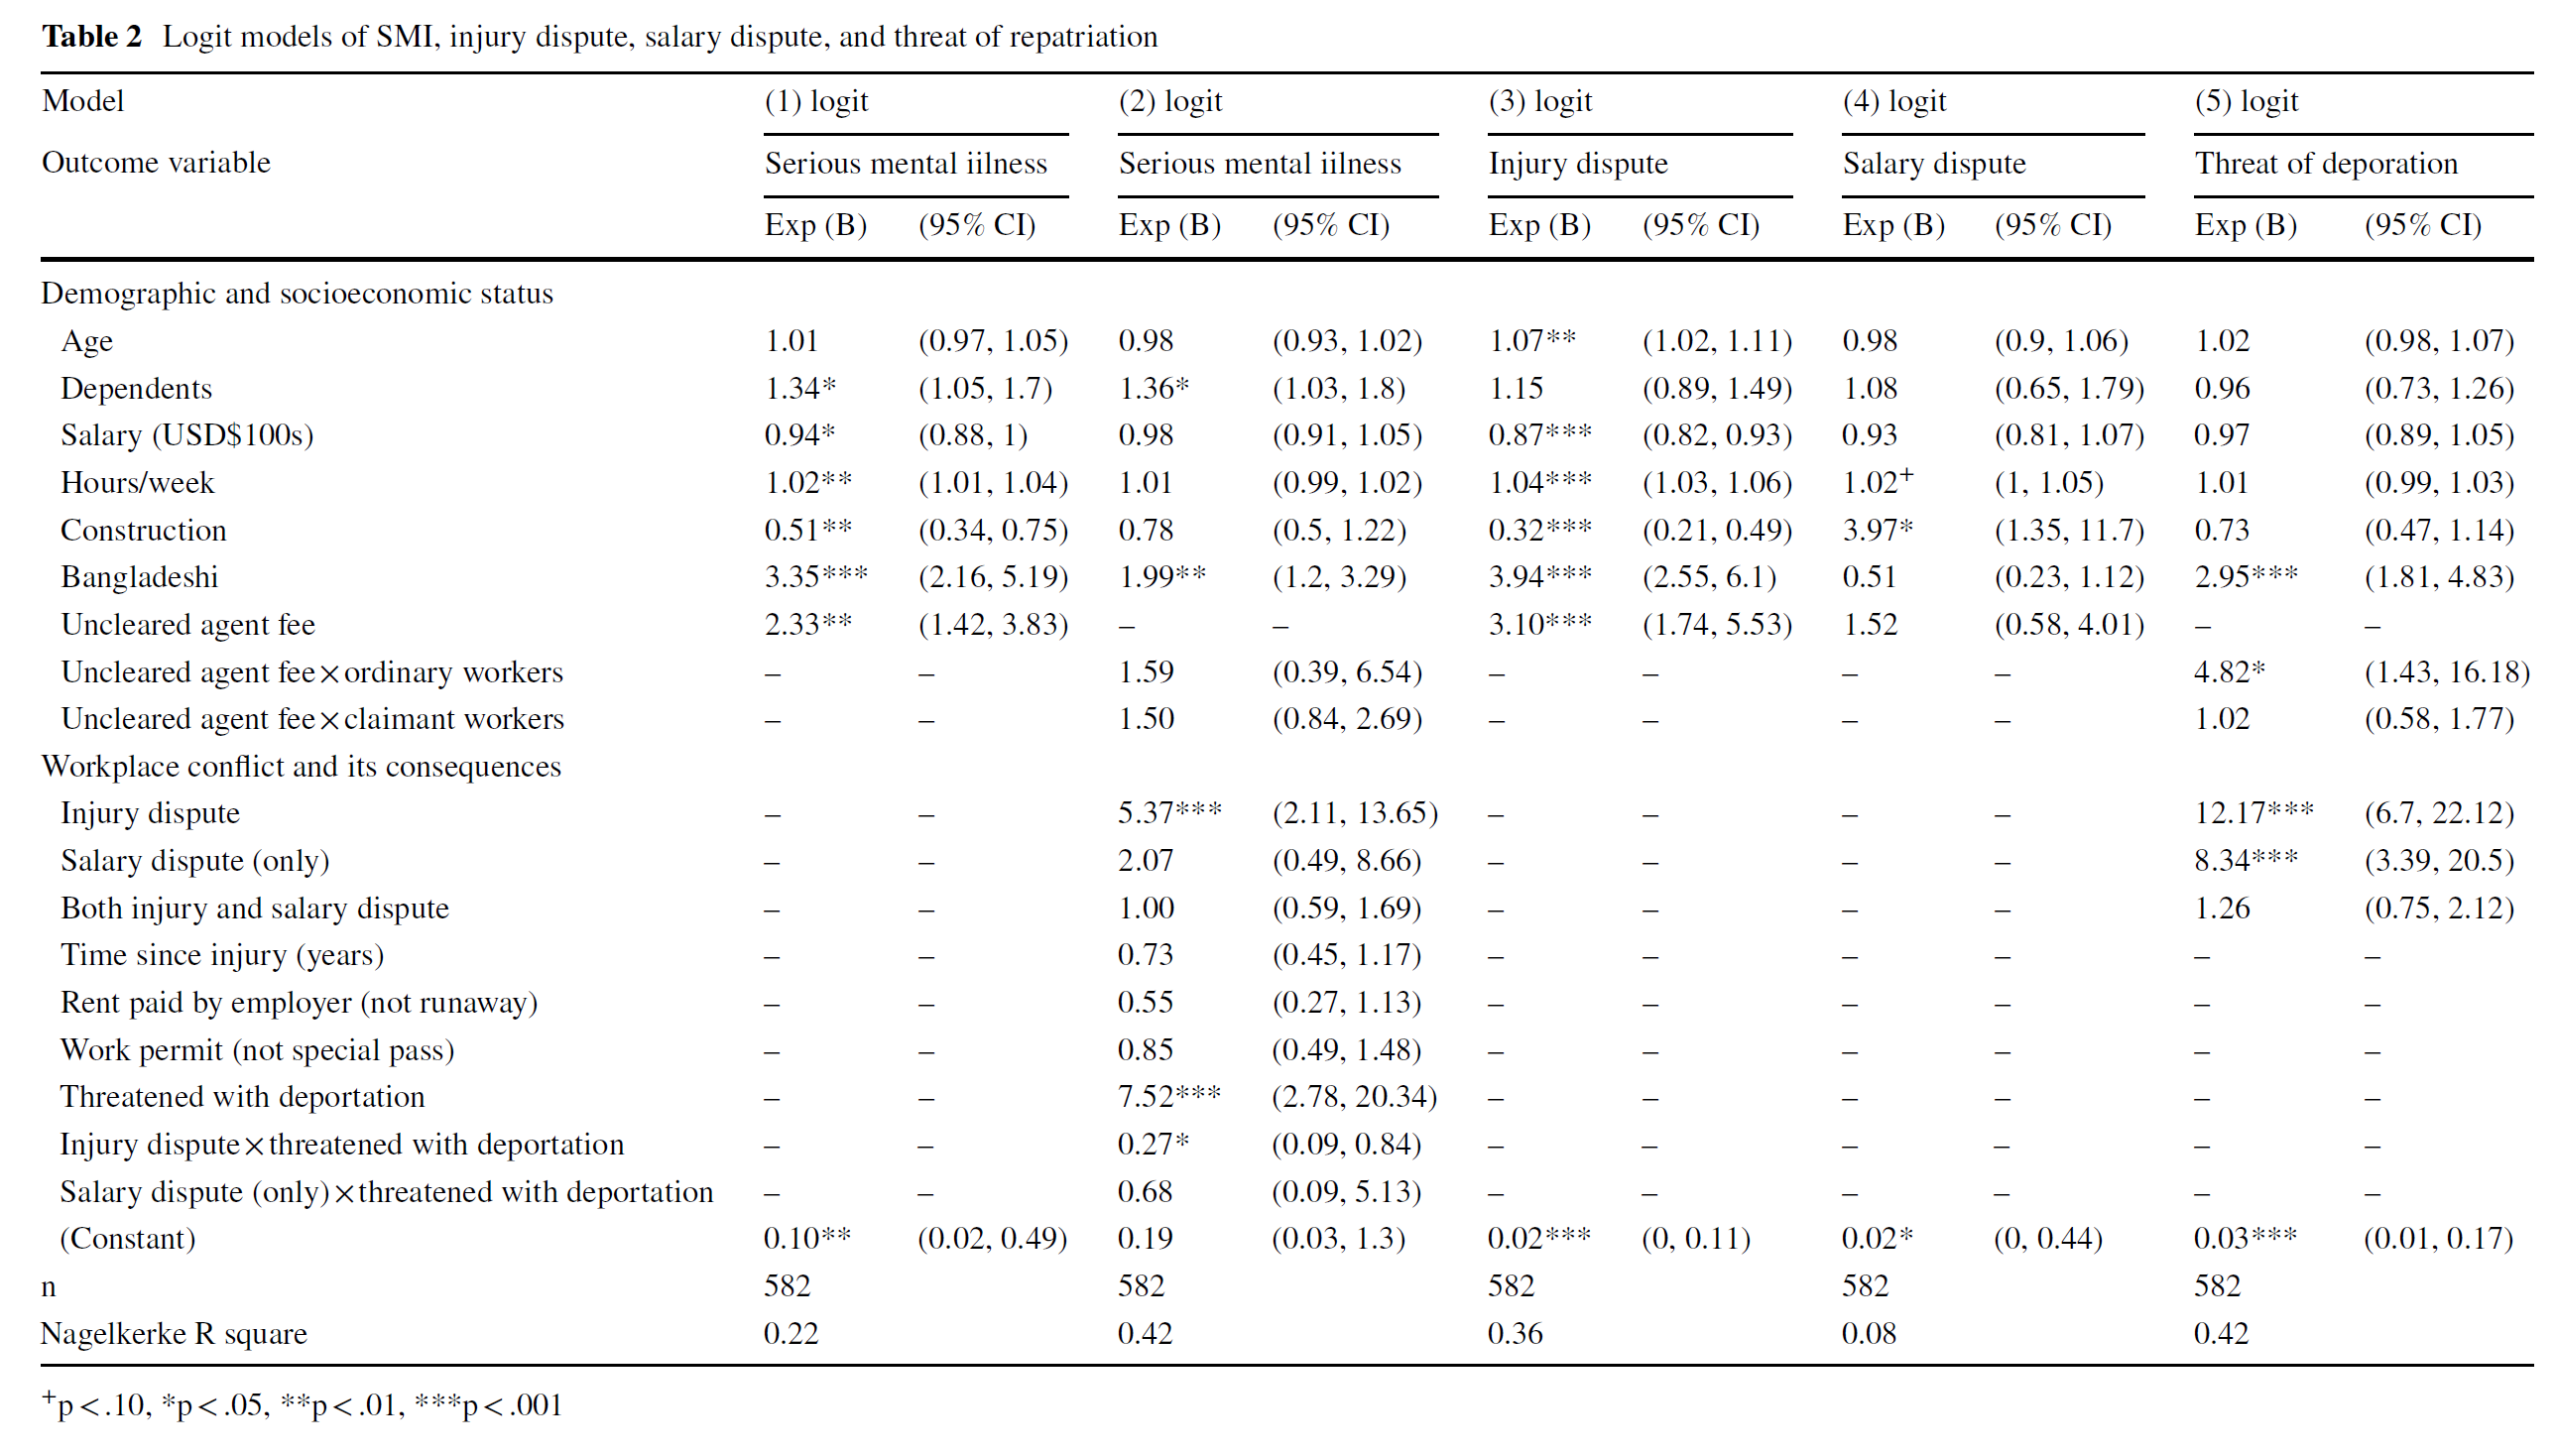
- Where is Model 2 in this figure? Model 3? Model 4? Model 5? Model 1?
3.2 Intro to the main causal pathways
When talking about variables we can think about four key pathways through which two or three variables can be related.
1. Direct effect of A on B (main effect)
The first is the direct effect on a variable A on another variable B. This is what we generally think of when we say that A caused B. We can represent this diagramatically as:
A -----> BExample 1: Samantha’s punch (A) causes James’s nose to bleed (B).
Example 2: Parents income (A) increases the likelihood of a person becoming a medical doctor (B).
2. Indirect effect of A on B through C (mediation)
The second causal pathway is the indirect effect of variable A on B through variable C. This is what we often call a pathway, a mediated relationship, or a mechanism. This can be represented diagramatically as:
           C
         /\  \
         /    \
        /     \/
       A       B
Example 1: Samantha’s punch (A) causes James’s nose to break (C) which causes James’s nose to bleed (B).
Example 2: Parents income (A) increases the likelihood of their child attend a private school (C) which increases the child’s likelihood of becoming a medical doctor (B).
3. Effect of A on B, moderated by C (moderation)
The third causal pathway is moderation. This is the interaction effect we learnt about last week. It occurs when a varable C changes the nature of the relationship between variables A and B. This can be represented diagramatically as:
            C
            ||
            ||
            \/
       A ---------> B
Example 1: When a woman punches a man (A) and the woman has great strength (C) the man’s nose tends to bleed (B).
Example 2: Parents income (A) combined with a child’s motivation to study together interact to (C) increase the child’s likelihood of becoming a medical doctor (B).
4. Effect of C on both A and B (spuriousness)
The fourth causal pathway is spuriousness. This occurs when there is a correlation between A and B, but it is not causal. Instead, the correlation between A and B is caused by a third variable C. Variable C causes both A and B. This can be represented diagramatically as:
          C
         / \
        /   \
       \/   \/
       A     B
Example 1: When people get angry (C), they tend to punch things (A) and their blood pressure rises, leading to nose bleeds (B).
Example 2: Adults who are ambitious and driven (C) tend to have higher incomes (A) and children who are medical doctors (B).
3.3 Rules and advice for doing path analysis
Most of the fundamentals of path analysis are actually simple and intuitive.
There are more complex version of path analysis such as Structural Equation Modelling (SEM) and mediation analysis, but these are only necessary for specific application, and beyond the scope of this course.
The main ‘guidelines’ are these:
1. Logic, theory, and assumptions determine direction of arrows.
If you are using cross section data, then you need ‘logical’ (i.e. an argument) and theoretical (i.e. some larger body of assumptions and knowledge which specifies relationships between variables) basis for choosing which variables are independent (i.e. purely causal), which are mediating (i.e. are both causes and effects of other variables), and which are dependent (purely outcomes).
2. Arrows can (normally) only go in one direction
Arrows can only go in one direction (or if they don’t go in only one direction, they are an association, not a ‘path’)
3. Cycles are (normally) not allowed
Arrows cannot form cycles (they must be acyclic). This is because if you have cycles in your diagram then you can get feedback/forward-feeding loops, which can’t be easily modelled with simple linear modelling
4. Variables with arrow pointing at them are dependent variables in a regression model
Any variable which has arrows coming into it is a dependent variable in a regression model
5. Interaction effects are arrow pointing in middle of another arrow
We represent interaction effects (moderation) between two variables as an arrow pointing at the middle of the relationship they are modifying.
6. Diagram type 1: all potential relationships
There are two main visual representations of all path models.
The first is of all potentially significant relationships that you are testing (i.e. all variables in your models). In this, an arrow represent a variable in the model (the source of the arrow) of a dependent variable (the target of the arrow).
6. Diagram type 2: statistically significant relationships
The second is the diagram of ONLY significant relationships. This is the diagram of the models after they have been run. In this you generally need distinguish between positive and negative relationships e.g. with dots and lines. You also need to include parameters and significance (e.g. stars * ).
3.4 An example
Let’s now review the logistic regression models from our example paper, and also compare them to the path diagram in Harrigan, Koh, and Amirrudin (2017)