Preparation
In this workshop, we continue working on the 2012 AuSSA dataset. Open the 2012 AuSSA data file that you saved in the workshop 3 (see <Figure 1>).
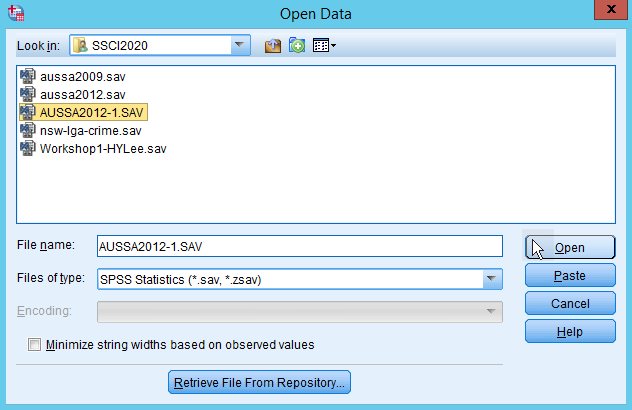
Figure 1: <Figure 1>
Recoding variables
Researchers often make a new variable using existing variables. This job usually involves transforming a variable by grouping its categories or values.
Creating a new variable of age groups
Suppose that we would like to know how many respondents are aged between 10 and 19, 20 and 29, 30 and 39, and so on. The best way to explore the distribution of age groups is to use a variable in which age is grouped in such a way. So, we are going to make a new age variable named agegrp using age variable. agegrp will have nine categories: Less than 20, 20—29, 30—39, 40—49, 50—59, 60—69, 70—79, 80—89 and more than 90. <Table 1> shows the recoding scheme of this task.
| Values | Values | Labels |
|---|---|---|
| 0 - 19 | 1 | Less than 20 |
| 20 - 29 | 2 | 20-29 |
| 30 - 39 | 3 | 30-39 |
| 40 - 49 | 4 | 40-49 |
| 50 - 59 | 5 | 50-59 |
| 60 - 69 | 6 | 60-69 |
| 70 - 79 | 7 | 70-79 |
| 80 - 89 | 8 | 80-89 |
| 90 or more | 9 | More than 90 |
| System- or user-missing | System-missing | System-missing |
- Go to Transform > Recode into Different Variables at the top menu.
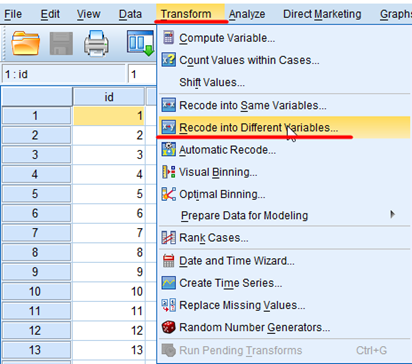
Figure 2: <Figure 2>
- In the box of Recode into Different Variables, select age in the left variable pane and move it to the right pane by clicking the arrow in the middle.
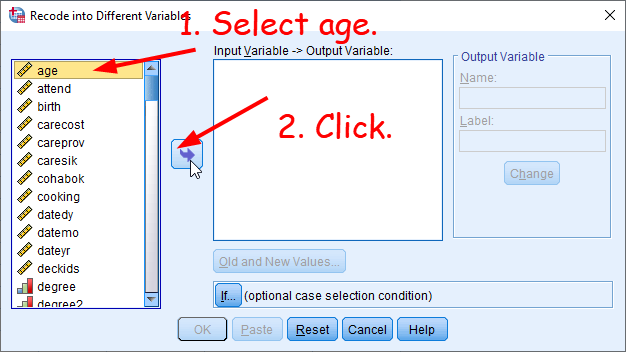
Figure 3: <Figure 3>
Troubleshooting: If you see variable labels instead of variable names, right-click at the left variable pane. Choose Display Variable Names. You will see variable names instead of variable labels. Also, choose Sort Alphabetically. Then, variables will be listed in an alphabetical order, which may make it easier to locate a variable of your interest. For more details, see the second step of Making a frequency table.
- In the middle white section, 1) you will see “age → ?”. In the section of Output Variable, 2) type a new variable name (agegrp) and its label (Age Group). 3) Click Change. “age → ?” will be changed into “age → agegrp”. Then, 4) click Old and New Values.
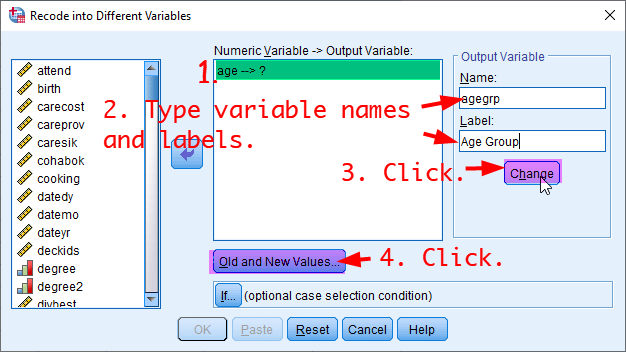
Figure 4: <Figure 4>
- You will see a new box of Recode into Different Variables: Old and New Values. In the section of Old Value, 1) select Range, LOWEST through value: and type 19. Then, 2) type 1 in the section of New Value. Click Add. This means that values less than or equal to 19 will be converted into 1.
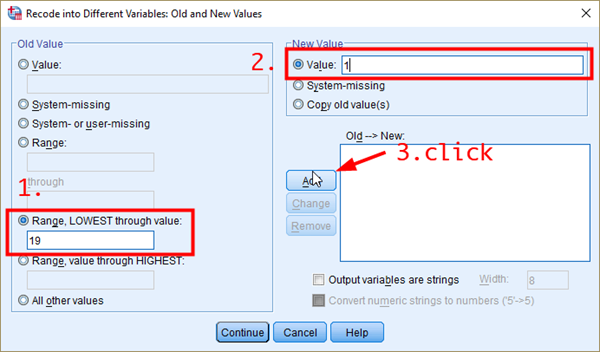
Figure 5: <Figure 5>
- After then, 1) select Range and type 20 through 29. 2) Type 2 in the section of New Value. 3) Click Add. This means that values between 20 and 29 will be converted into 2.
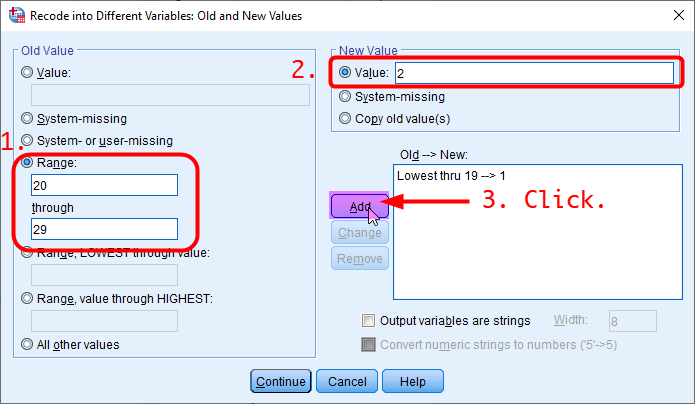
Figure 6: <Figure 6>
- Do the same procedure for other categories except for the final category. Then, your dialogue box should look like <Figure 7>.
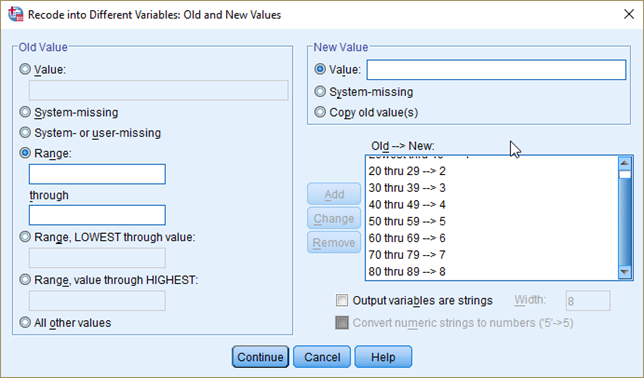
Figure 7: <Figure 7>
- Now, we will make the final category. 1) Select Range, value through HIGHEST: and type 90. Then, 2) type 9 in the section of New Value. 3) Click Add. This means that values equal to or greater than 90 will be converted into 9. After then, 4) click Continue at the bottom.
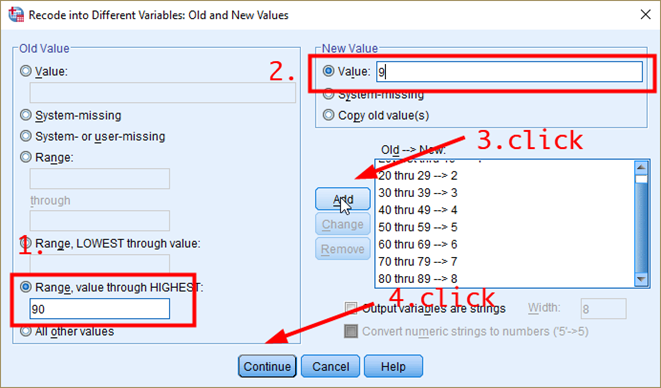
Figure 8: <Figure 8>
- We need one more step. 1) select System- or user-missing in the section of Old Value and System-missing in the section of New Value. 2) Click Add. This will convert all missing values in age into missing values in agegrp. Click Continue at the bottom.
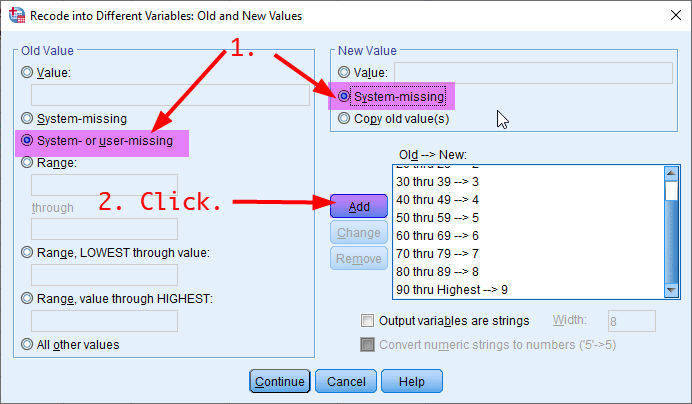
Figure 9: <Figure 9>
You will be back to the previous dialogue box. Click OK at the bottom.
In Data View, you will see the newly generated variable, agegrp, in the rightmost column.
Go to Variable View, assign value labels to values as in <Table 1>. Also, change the level of measurement for agegrp into Ordinal and set Decimals to 0. If you are not sure how to do these tasks, review How to enter data.
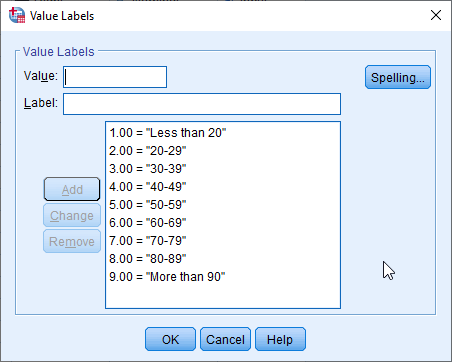
Figure 10: <Figure 10>
Collapsing response categories
Sometimes we want to make a variable in which all responses are collapsed into two categories (e.g., whether people agree or don’t agree with a statement). Suppose that we want to make a variable which tells whether respondents agree or don’t agree with the statement that a preschool child is likely to suffer if his or her mother works. We will make a new variable, dichfepresch, using fepresch. <Table 2> shows the recoding scheme of this new variable.
| Values | Labels | Values | Labels |
|---|---|---|---|
| 1 | Strongly agree | 1 | Agree |
| 2 | Agree | ||
| 3 | Neither agree nor disagree | 0 | Don’t agree |
| 4 | Disagree | ||
| 5 | Strongly disagree | ||
| 8 | Can’t choose | System-missing | System missing |
| 9 | No answer |
- Go to Transform > Recode into Different Variables. You will see age → agegrp is still there. Click Reset at the bottom, which will remove all the previous settings. Every time you start a new task in SPSS, don’t forget to click Reset first.
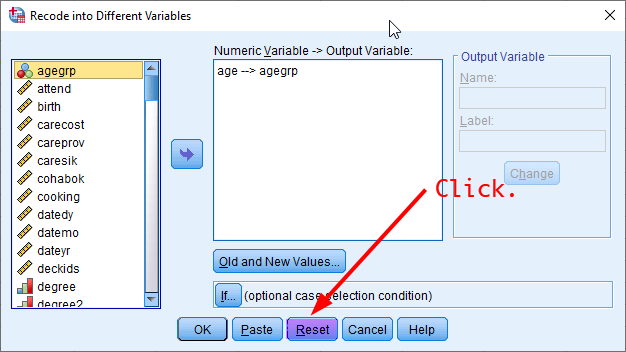
Figure 11: <Figure 11>
- In the box of Recode into Different Variables, 1) select fepresch in the left variable pane (Make sure that fepresch should be assigned as an ordinal variable in Variable View) and 2) click the arrow in the middle. Then, you will see “fepresch → ?”. In the right pane of Output Variable, 3) type a new variable name (dichfepresch) and its label (Dichotomising fepresch). 4) Click Change. “fepresch → ?” will be changed into “fepresch → dichfepresch”. Then, 5) click Old and New Values.
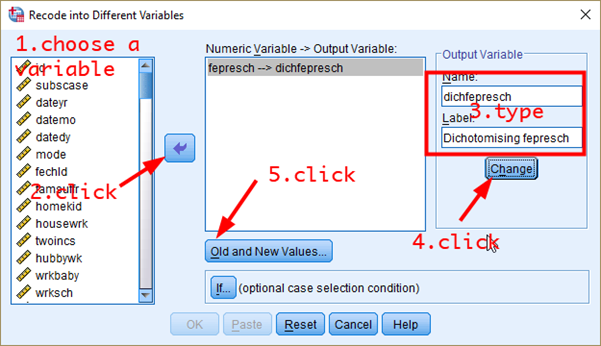
Figure 12: <Figure 12>
- Select System- or user-missing in the section of Old Value and System-missing in the section of New Value. Click Add. When you recode a variable, you MUST convert missing values in the old variable into missing values in the new variable.
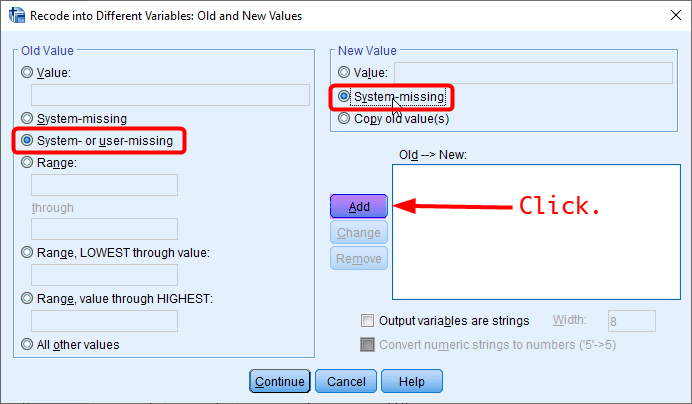
Figure 13: <Figure 13>
- Choose Range and type 1 through 2 in the section of Old Value. Type 1 in the section of New Value. Click Add.
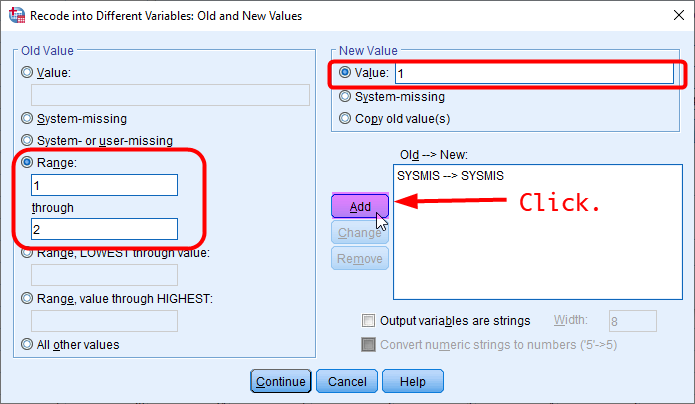
Figure 14: <Figure 14>
- Choose Range and type 3 through 5 in the section of Old Value. Type 0 in the section of New Value. Click Add. Then, click Continue at the bottom.
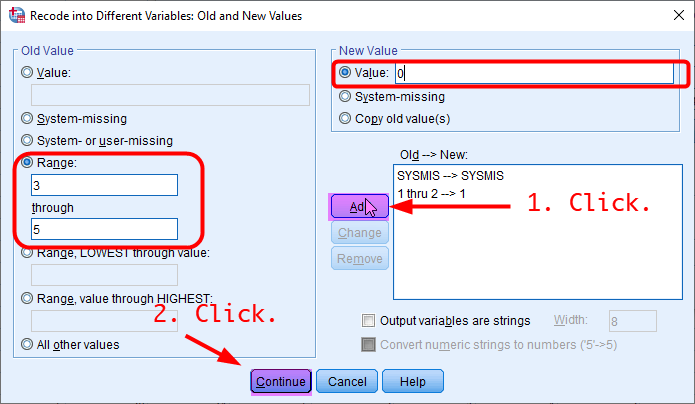
Figure 15: <Figure 15>
You will be back to the previous dialogue box. Click OK at the bottom.
In Data View, you will see the newly generated variable, dichfepresch, in the rightmost column.
Go to Variable View, assign value labels to values as in <Table 2>. Also, change the level of measurement for dichfepresch into Nominal and set Decimals to 0.
To check whether your new variable is created correctly, make a frequency table of dichfepresch. Compare your output with <Figure 16>. If your frequency table doesn’t look like <Figure 6>, it is likely that you made mistakes in recoding fepresch.
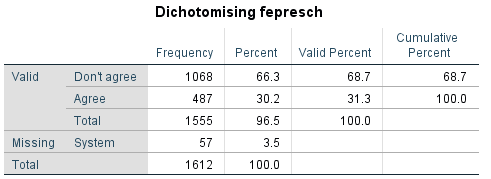
Figure 16: <Figure 16>
Computing variables
Creating a variable of birth years
Suppose that we want to make a new variable of birth years using age. Given that the survey was conducted in 2012, the relationship between birth years and age is:
\(Birth year = 2012 - Age\)
Let’s make a variable of birth years using the Compute command. Compute lets you construct a new variable by using functions like arithmetic or statistical functions. In this example, we will use an arithmetic function (i.e., addition, subtraction).
- Go to Transform > Compute Variable.
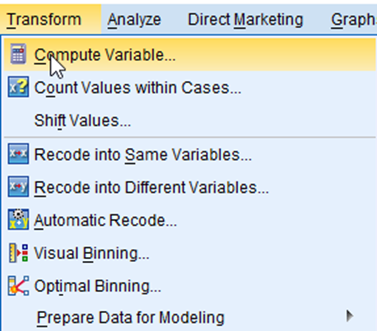
Figure 17: <Figure 17>
- In the window of Compute Variable, 1) type a name of new variables (in this example, it is byear) in the section of Target Variable:. 2) Type an equation that shows the relationship between old and new variables in the section of Numeric Expression: (in this example, \(2012 – age\)). 3) Click Type & Label, which will show a new window. 4) Type a label of new variables (in this example, it is “Birth Years”) and 5) click Continue at the bottom. 6) Click OK. After then, go to Variable View. You will see a newly created variable, byear, at the bottom.
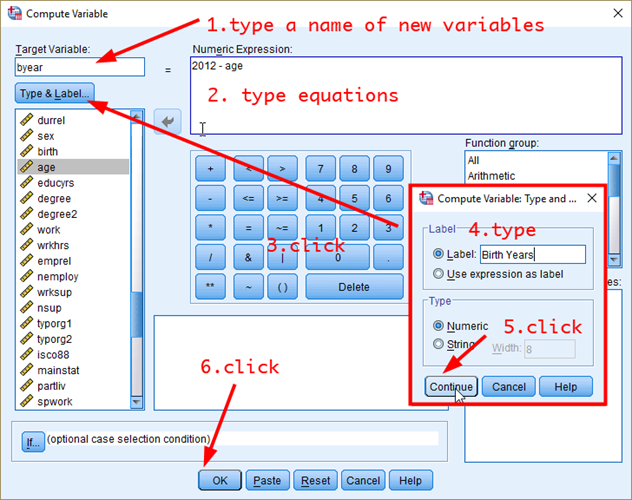
Figure 18: <Figure 18>
Creating a new variable by combining multiple variables
This time we will make a new variable, which is the mean age of couples. This new variable (avgcoupage) can be generated using the following equation:
\(avgcoupage = \frac {Respondent's\ age\ (age)\ +\ Spouse's\ age\ (spage)} {2}\)
Go to Transform > Compute Variable. And click Reset at the bottom.
In the window of Compute Variable, 1) type avgcoupage in the section of Target Variable:. 2) Type \((age+spage)/2\) in the section of Numeric Expression:. 3) Click Type & Label, which will show a new window. 4) Type a label of new variables (in this example, “Average Age of Couples”). 5) Click Continue at the bottom. 6) Click OK at the bottom. After then, you will see a newly created variable, avgcoupage.
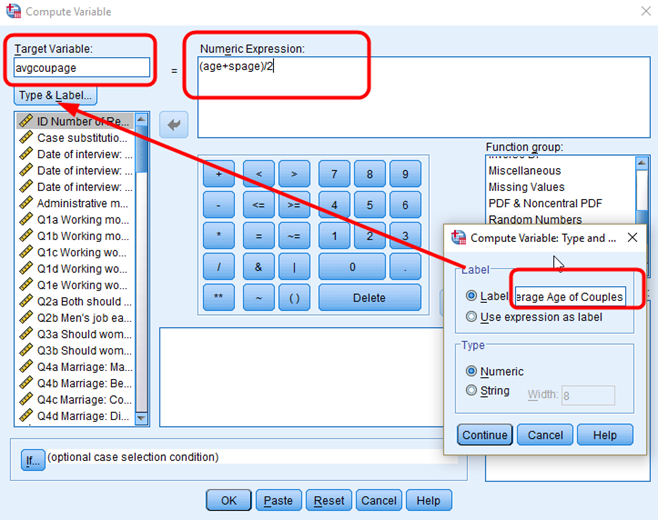
Figure 19: <Figure 19>
Note that you will see a lot of missing values(.) in a newly made variable (see <Figure 20>). This is because we cannot calculate the average age of couples for people without a partner or spouse. Those who don’t have a partner of spouse will have missing values in avgcoupage.
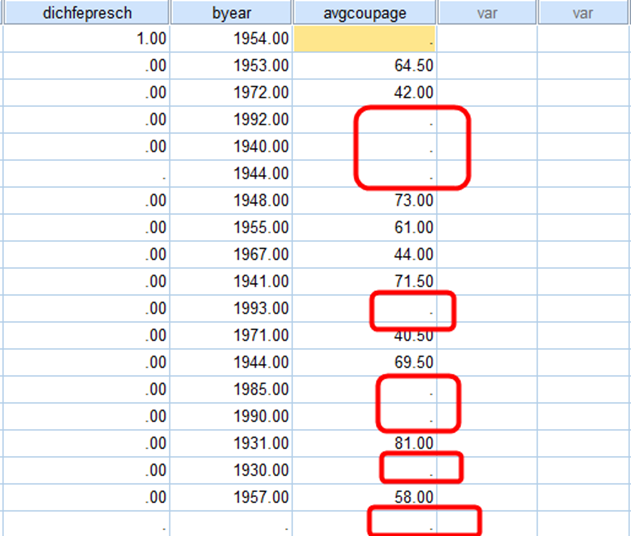
Figure 20: <Figure 20>
Workshop Activity 4: Recoding variables |
||||||||||||||||||||||||||||||||||||||||||||||
|