This workshop introduces the Data for Crime Rates of Local Government Areas in New South Wales. The data include information on the crime rate, population, economy and residents of local government areas (LGAs) in New South Wales. The information is from various sources. For detailed descriptions of variables, see “Codebook of Crime Rates of NSW LGAs” (iLearn).
Download Data File for Crime Rates of NSW LGAs on iLearn (under the section of Dataset). Then, upload this file to your SSCI2020 as you did for the 2012 AuSSA dataset. If you completed Preparation for the Workshops, this data file is already in your SSCI2020 folder at AppStream.
Open “nsw-lga-crime.sav” in SPSS (See <Figure 1>). Then, you are ready to start the workshop 5.
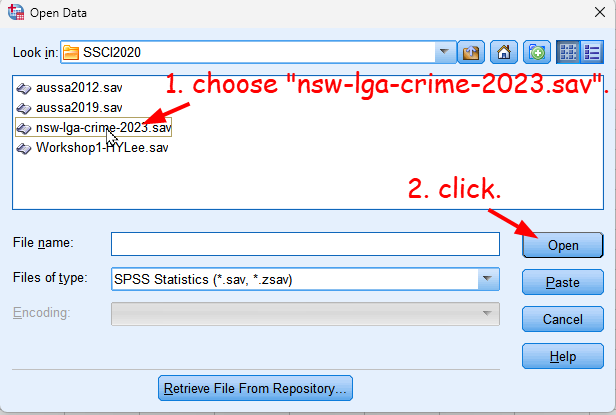
Figure 1: <Figure 1>
Moving (or Relocating) variables
When you have many variables in your dataset, it is often difficult to locate a specific variable of your interest when you browse the data. In that case, you can move a variable to a new location in the Variable View. Suppose that we want to move region next to lga.
- In the Variable View, Click the row number of a variable that you intend to move (in this example, it is region). This will highlight the row of the selected variable.
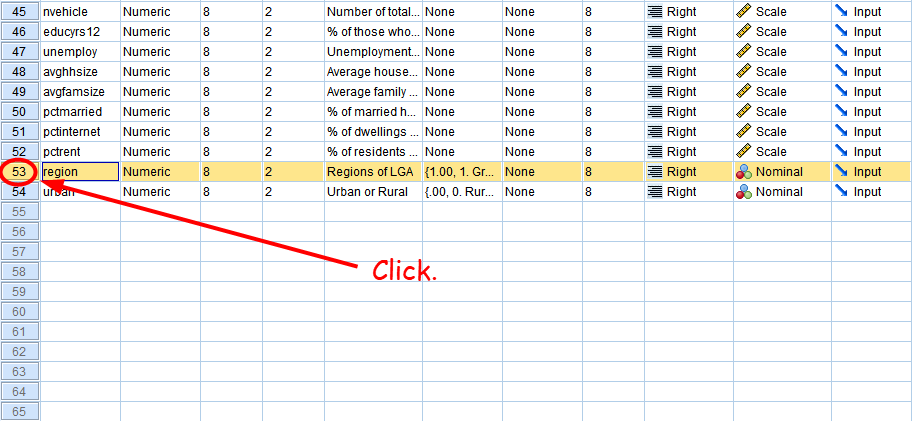
Figure 2: <Figure 2>
- Drag and drop the variable to the new location (in our case, just below lga).
Figure 3: <Figure 3>
- You will see region just below lga.
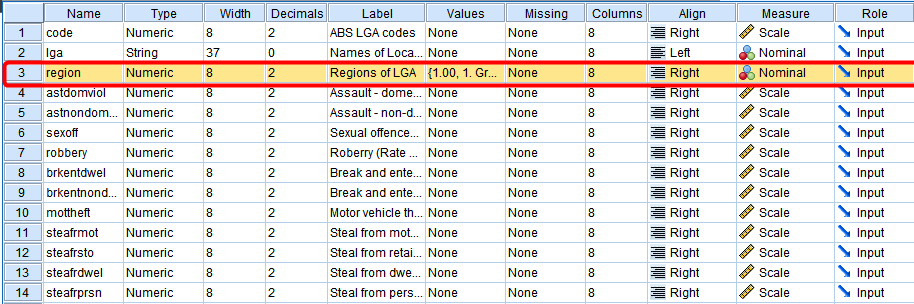
Figure 4: <Figure 4>
- Go to Data View. You will see that region is located nicely next to lga.
Figure 5: <Figure 5>
Sorting cases
Sorting cases may be necessary when you want to have a close look at the data. Sorting cases will re-arrange the rows (cases) in the dataset by any variable or combination of variables you wish. By default, the cases will be sorted in ascending order (smallest to largest, or alphabetical). But sometimes it may be helpful to sort cases in descending order (largest to smallest, or reverse alphabetical).
Sorting cases by a single variable
Suppose that we want to know which local government area (LGA) in NSW has the highest crime rates of robbery (robbery). Sorting all the NSW LGAs in descending order by robbery will make this job more manageable.
- Go to Data > Sort Cases.
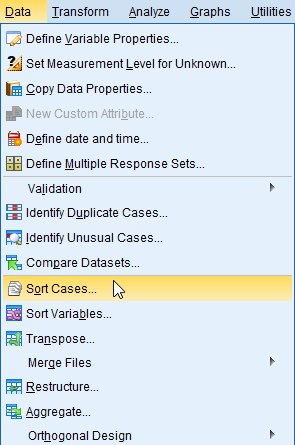
Figure 6: <Figure 6>
- In the box of Sort Cases, select a variable by which cases will be sorted and move them to the section of Sort by:. And choose Descending in the section of Sort Order. Click OK at the bottom.
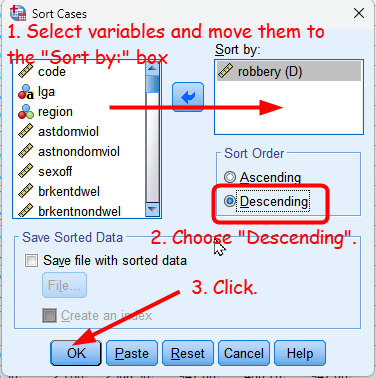
Figure 7: <Figure 7>
- In Data View, you see that cases (LGAs) are sorted by robbery rates. The LGA with the highest rate of robbery is Liverpool Plains Shire, and the Byron Shire has the lowest robbery rate (excluding LGAs having missing values on robbery rates).
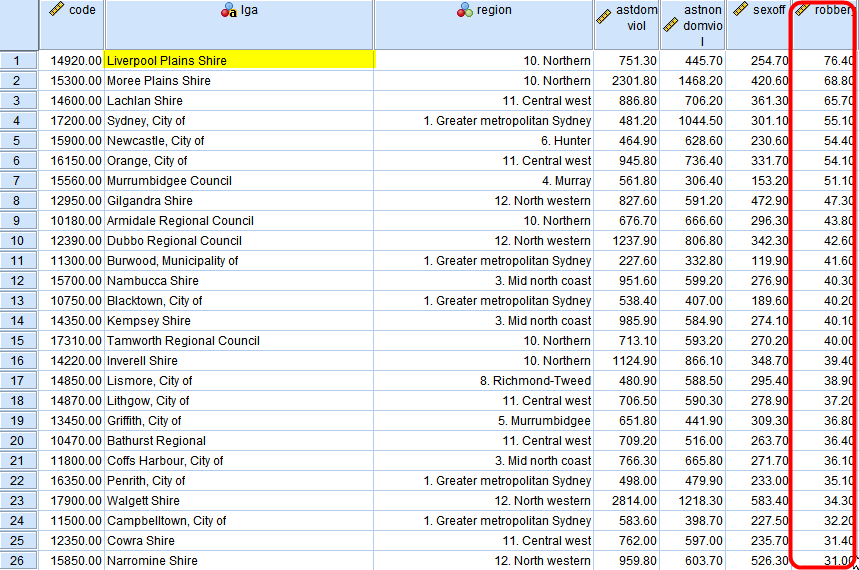
Figure 8: <Figure 8>
Sorting cases by multiple variables
It is often the case that we need to sort cases by more than one variable. Suppose that we would like to find an LGA with the highest robbery rates in the Greater Metropolitan Sydney, Murray and Hunter, respectively. To find them, it is necessary to sort all the LGAs by the combination of region and robbery.
Go to Data > Sort Cases. In the box of Sort Cases, click Reset at the bottom. It will remove the variable you used before. Move region first and then robbery to the section of Sort by:. When you use more than one variable on which cases are sorted, the order of variables matters. In this example, the cases will be sorted first by region in ascending order. Then, within each region, cases will be sorted by robbery in descending order. You can reorder variables in the section of Sort by: by clicking and dragging the variable of which you want to change the order.
You can set either an ascending or descending order for each variable. Click on a variable in the section of Sort by: and choose either Ascending or Descending. In this example, we choose Ascending for region and Descending for robbery. Then, click OK.
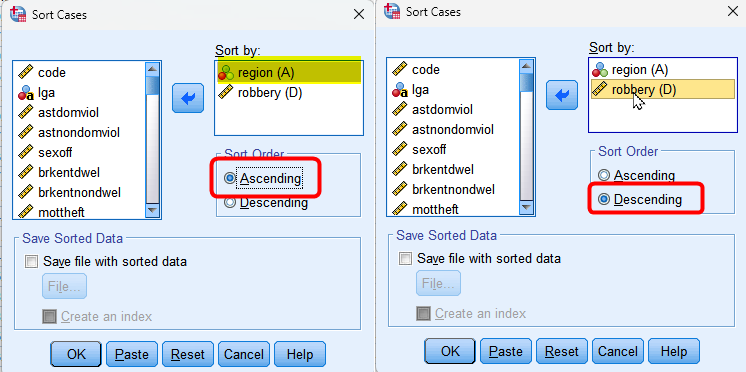
Figure 9: <Figure 9>
- In Data View, you will see all the cases sorted by region and robbery. LGAs in the Greater Metropolitan Sydney (coded as 1) appear first, those in the Sydney Surrounds (coded as 2) second and so forth. Within the same area, an LGA with the highest robbery rate appears first, and that with the lowest robbery rate appears last. Therefore, you will be able to easily find which LGA has the highest and lowest robbery rate in each area.
Troubleshooting: If you see numbers instead of the names of region in region, go to View at the top menu and tick Value Labels (See <Figure 15> of the workshop 1).
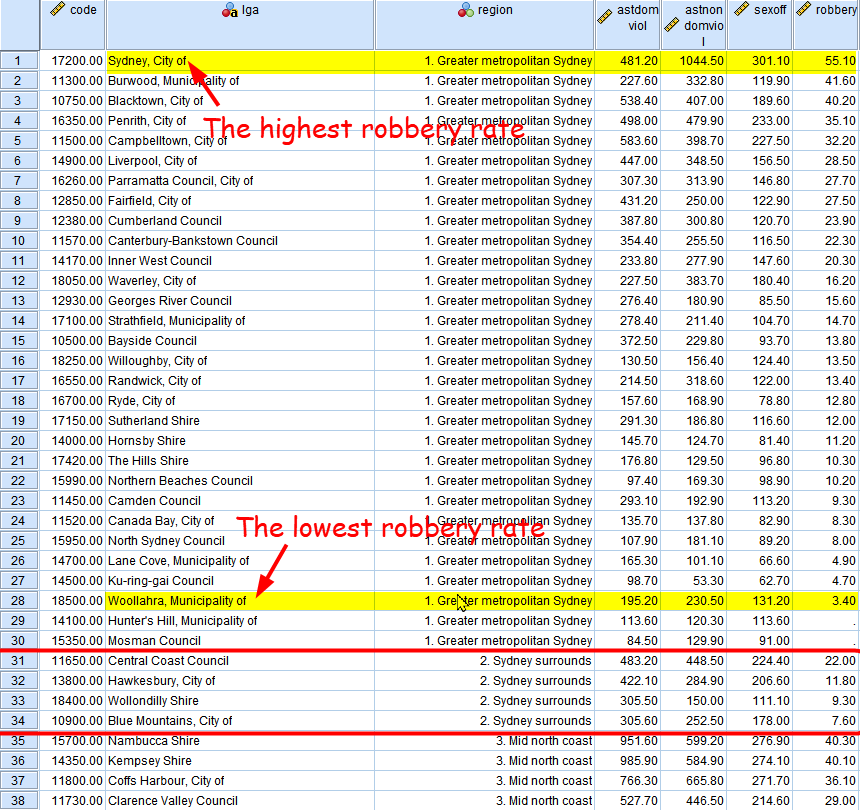
Figure 10: <Figure 10>
Creating z-scores for variables
This section will show how to make a variable in which the value is the standardised score (z-score) of a variable of your choice. Suppose that we want to make a variable which is the z-score of medage (median age of residents).
- To create a variable of z-scores, go to Analyze > Descriptive Statistics > Descriptives.
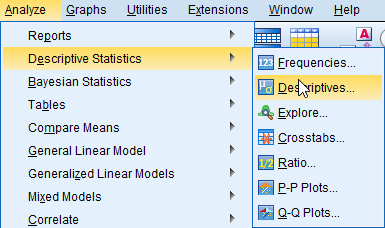
Figure 11: <Figure 11>
- Select a variable for which you want to create z-scores and move it to the box of Variable(s). Then, tick the box of Save standardized values as variables. Click OK.
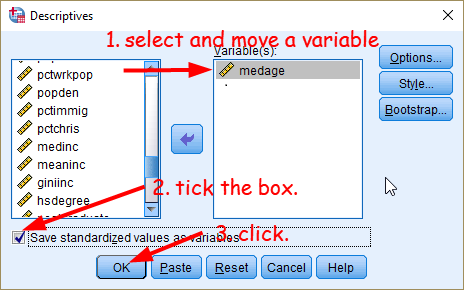
Figure 12: <Figure 12>
- You will see a newly created variable, Zmedage, in the lowermost row of Variable View. Move this new variable just below to medage for easier comparison (If you are not sure how to do this, see Moving (or Relocating) variables again in this workshop instruction). Then, your Data View looks like <Figure 13>.
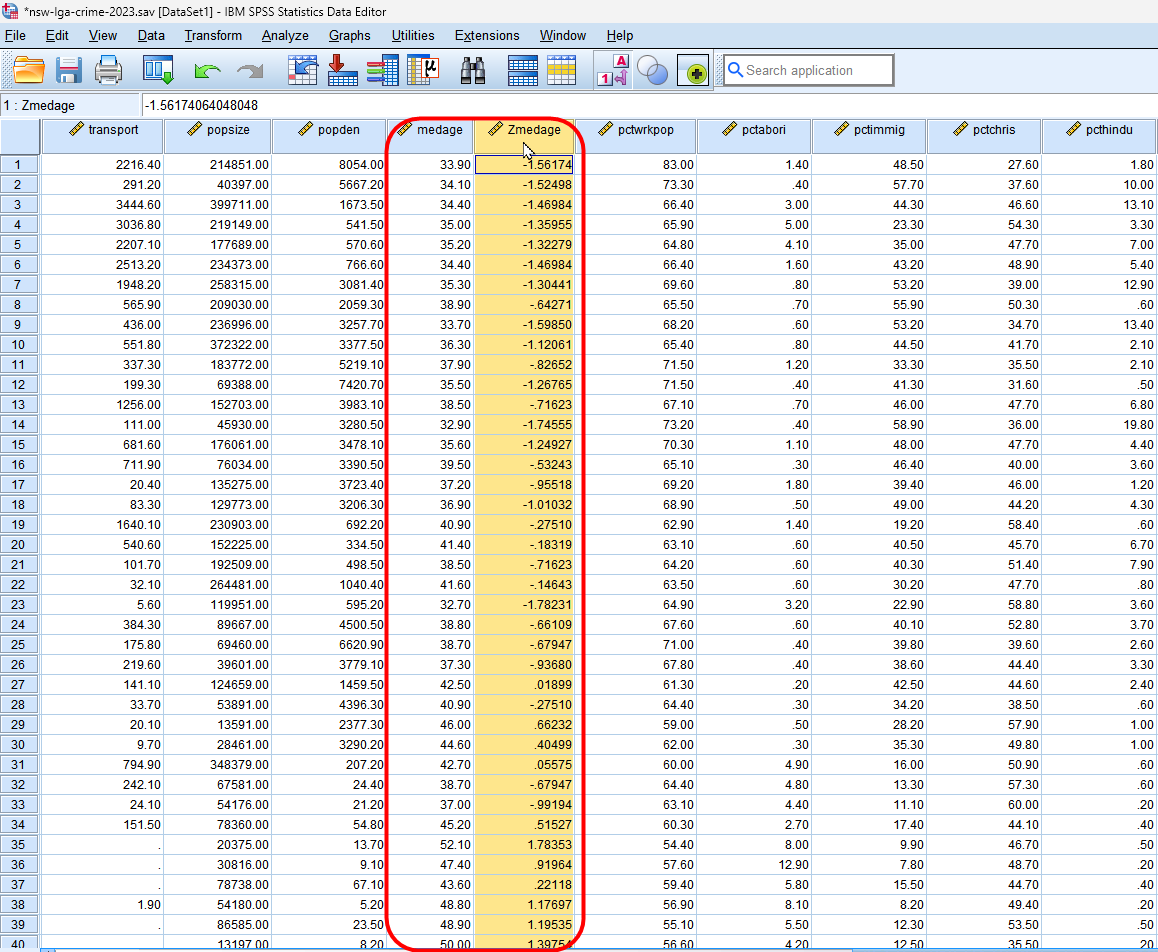
Figure 13: <Figure 13>
Workshop Activity 5: Exploring NSW Crime Data |
|
Using the Data for Crime Rates in Local Government Areas in New South Wales, answer the following questions.
|