SOCI832: Lesson 2.1: An introduction to research methods

Reading

Field, A., Miles, J., and Field, Z. (2012). Discovering statistics using R. Sage publications.

  • Chapter 1: Why is my evil lecturer forcing me to learn statistics?


Concepts

Research
Theory testing
Conceptualisation and operationalisation
Levels of measurement
Scales and indexes
Reliability and validity


Learning Objectives

By the end of this class, students should be able to:

  1. Identify the theory being tested in an academic paper.
  2. Distinguish between theoretical frameworks (like religions), theoretical explanations (complex, but subject to evidence and argument), and hypotheses (statements which can test one prediction of theory).
  3. Identify the units of analysis and the variables in a social science analysis
  4. Identify the dependent variable, independent variables, and control variables in an analysis
  5. Identify the conceptualisation of a variable, and the operationalisation of a variable, and to suggest different ways that a particular variable could be conceptualised or operationalised differently.
  6. To be able to state what level of measurement a variable is measured at, particularly with respect to the categorisations of: categorical, binary, ordinal, continuous (or interval).
  7. Identify a scale or index in an academic paper.
  8. Search the internet and academic databases and find scales or indexes in the academic literature for a particular concept.
  9. Explain in everyday language what reliability and validity are, with examples.


Questions

  • What is research methods, why does it matter, and how does it relate to statistics?
  • How do I distinguish between a theoretical framework, a theoretical explanation, and a hypothesis?
  • How do I identify the units of analysis and the variables in a study?
  • How do I distinguish between the dependent variable, independent variables, and control variables?
  • How do I properly conceptualise a variable?
  • How do I properly operationalise a variable?
  • How can I tell if a variable is measured as a categorical, binary, ordinal, or continuous (or interval) variable?
  • How do I make a scale or index? How do I identify them in an academic paper?
  • How do I find a good (validated) scale or index in the academic literature?
  • How do I know if my variable or scale or index is reliable and/or valid?


Concept Map

Concept Map of Week 2: Research Methods

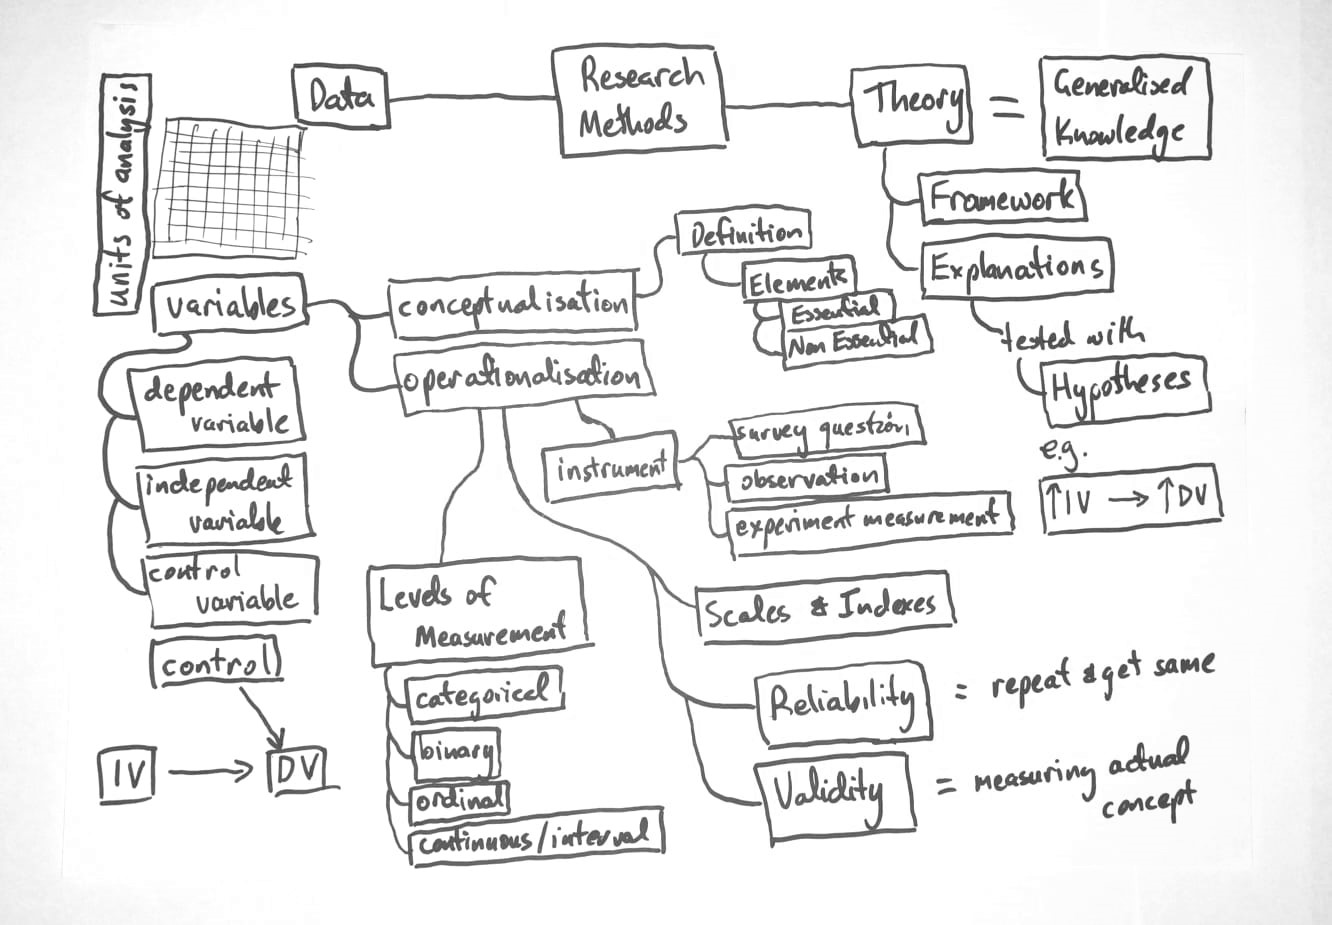
Figure 1: Concept Map of Week 2: Research Methods


Summary

Testing Theories

The main purpose of academic research is to create generalised knowledge: knowledge which provides explanations across more than just the situation, example, or cases being studied.

Social scientists develop, discuss, and formalise generalised knowledge through the development and testing of various social theories. These theories are complex abstractions.

When social scientists use the word theory they generally mean either (1) frameworks - such as Marxism, functionalism, or rational choice theory - which like religious or political beliefs, are important abstract conceptions of the world, but ultimately are difficult to test. The other meaning of theory is (2) explanations. Explanations provide an account of how or why some outcome occurs. Explanations are distinguished from frameworks by, firstly, focusing on an outcome; and, secondly, containing testable predictions about the observable world.

The progress of academic knowledge - generalised knowledge - tends to develop through the contestation of competing explanations (theories). Competing explanations are evaluated by testing hypotheses - statements about what we should find in the observable world - where the explanations make different predictions.

Variables

For statistical analysis we represent the observable world as a data table with rows and columns. The table is comprised of multiple entities - such as people - and their characteristics - such as their age, gender, or political beliefs. We call the entities being studied units of analysis, and these units of analysis are the rows of the table of data.

The characteristics measured on these entities (units of analysis) are called variables (since they vary across units of analysis). In statistical the characteristics (variables) are the columns of the table of data.

We distinguish between three main types of variables (i.e. characteristics of our units of analysis) by naming variables according to whether they are ‘causes’, ‘effects’, or ‘other explanations’.

  • A dependent variable is an outcome we are interested in, and generally the ‘effect’ in some cause-effect statement or theory.
  • An independent variable is a predictors or ‘cause’ in some cause-effect statement or theory.
  • Control variables are any ‘other factors’ which might influence our outcome. Often control variables are competing explanations.

Conceptualisation and Operationalisation

To collect data we need to be able to measure the social world. Measurement is said to involve two steps conceptualisation (developing ideas, concepts), and operationalisation (developing measurement instruments).

The conceptualisation of a variable is normally captured in a written definition. Definitions are comprised of two main components - essential characteristics and non-essential characteristics. Essential characteristics, as the name implies, are necessary, while non-essential characteristics, are those characteristics often associated with the concept, but not necessary. A useful way to illustrate and highlight the importance of essential characteristics to a definition is to identify examples of the concept with all the essential characteristics, and also non-examples, which are missing just one essential characteristic.

Operationalisation involves developing an instrument for measuring your concept (conceptual variable). Social scientists use a wide variety of instruments to measure the real world - survey questions, direct observation, experiments, or counting of words in text.

Levels of measurement

In statistical analysis, it is an essential requirement that these measurements be transformed into numbers. We talk about (at least) four types of numbers - levels of measurement - in quantitative data collection:

  • categorical/nominal (unordered categories, e.g. colours, brands of car),
  • binary (two unordered categories, e.g. dead/alive, pregnant/not-pregnant, female/not-female),
  • ordinal (discrete, ordered categories, e.g. likert scale: strongly agree to strongly disagree),
  • continuous (or interval) (ordinal with known distance between categories, e.g. temperature, IQ, GPA, the date)

Scales and indexes

Measurement can be improved by using multiple instruments or measures for the same conceptual variable. We call a measurement comprised of multiple smaller measurements a scale or an index.

Reliability and validity

We can test the quality of our measurement by assessing reliability and validity. Reliability is high when a measurement gives the same answer when repeatedly measuring the same ‘thing’. Reliability can be measured with correlations between test and retest on the same subjects, or subjects assessed to have similar values of a variable based on some more strenuous objective assessment (e.g. an examination by a professional).

Validity is high when a measure actually measures the concept it says it is measuring. Validity is generally assessed by (1) the judgement of experts; (2) correlation with validated measures; or (3) correlation with expected outcomes. The easiest way for a social scientists to ensure they use reliable and valid measures is to use measures from published studies of other social scientists.


1. Research methods: What is it? Why does it matter? And how does it relate to statistics?

1.1 Definition of research

Research can be definied as systematic investigation.

1.2 In one word or phrase

In one word or phrase, research could be summarised as (1) careful; (2) looking.

Being systematic (or ‘careful’), research tends to follow formal rules and established processes. It isn’t haphazard and idocyncratic. Involving investigation (or ‘looking’) means research is empirical. It is based on evidence. It is not just thinking, or philosophy, or argument. Research methods, the topic of this week, is the proceedures (i.e. methods) for research, particularly in our case, social science research.

1.3 Why should we care about learning research methods?

You are probably thinking, why can we just skip research methods, and go straight to the statistics and the programming in R?

The advantages of spending a week on research methods are:

  • we can learn some of the universal language of research design.
  • these concepts make it easier to think about how we test and create knowledge.
  • these concepts are implicit (and explicit) in almost every journal article we read.

1.4 How does research methods relate to statistics?

Statistics is PART of research methods.

We can think of four fundamental steps of research:

  1. Design
  2. Data collection
  3. Data analysis
  4. Writing up/communicating

Statistics is ONE of the methods of doing Step 3: data analysis.

Statistics is, however, just one of the many methods of data analysis. We can use qualitative methods, like thematic analysis, or non-statistical quantitative methods, like simple sums, means, and tables.

But research methods is about much MORE than statistics.

We assume good research methods when we do statistics - we assume sound research design, we assume our hypotheses test our theories, and our variables measure the concepts they say they do. In these ways, good research methods is a foundation that makes statistical analysis possible.

2. Theory: How do I distinguish between a theoretical framework, theoretical explanation, and a hypothesis?

2.1 Generalised knowledge: The goal

While social science research is empirical and grounded in the observable, it’s goal is conceptual and in the realm of abstract ideas.

The main purpose of academic research is to create generalised knowledge: knowledge which provides explanations across more than just the situation, example, or cases being studied.

Social scientists develop, discuss, and formalise generalised knowledge through the development and testing of various social theories.

These theories are complex abstractions. What does ‘complex abstraction’ mean?

  • Complex: there are many many moving parts, assumptions, events, entities, variables in a theory. A theory does not just say A causes B, or C correlated with D.
  • Abstraction: theories are always a simplification of the world. They emphasize one aspect of the world so that we can reduce it’s complexity to a level we can think at.

2.2 Frameworks vs Explanations: Two types of theories

When social scientists use the word theory they generally mean either:

  1. frameworks - such as Marxism, functionalism, or rational choice theory - which like religious or political beliefs, are important abstract conceptions of the world, but ultimately are difficult to test, or
  2. explanations. Explanations provide an account of how or why some outcome occurs. Explanations are distinguished from frameworks by, firstly, focusing on an outcome; and, secondly, containing within the many complex ideas, some testable predictions about the observable world.

The progress of academic knowledge - generalised knowledge - tends to develop through the contestation of competing explanations (theories).

Competing explanations are evaluated by testing hypotheses - statements about what we should find in the observable world - where the explanations make different predictions.

2.3 Telling the difference: How do I know if it is a framework, an explanation or a hypothesis?

While there are no hard and fast rules, I would suggest the following:

  • frameworks
    • are generally not testible
    • more like a world view, or a religious or political belief
    • difficult to ever prove right or wrong

    E.g. Marxism, Functionalism, Post-moderism, Rational Choice Theory.

  • explanations
    • focus on explaining a single outcome (e.g. health, death, working hours, democracy)
    • potentially testible
    • able to have empirical data collected about them
    • have clear, direct, identifiable alternative explanations which could explain the same outcome.

    E.g. Strength of Weak Ties, Bowling Alone (decline of Social Capital), Cartel Party theory, Median Voter theorum.

  • hypotheses
    • statements about two or more variables
    • clear, testible predictions about the relationship between the variables
    • are almost always of the form “The more X, the more Y.” or “The more X, the less Y.”"

    E.g. That (good) jobs will me more likely to come from weak ties contacts.
    <E.g. That overtime there has been a decline in social capital in USA (and other countries).
    E.g. That modern parties will show collusion with each other to use the state to their own advantages against smaller parties and other social forces.

3. Variables and Units of Analysis: How do I identify them in a study?

Standard social science data is stored as what we now thinking of as a ‘spreadsheet’ in a program like Microsoft Excel.

Standard social science data is stored in a table, where:

  • the rows are individual units of analysis (e.g. one survey respondant per row)
  • the columns are variables on those units of analysis. i.e. they are characteristics of the units of analysis (e.g. age, gender, political vote last election, etc.)

Units of analysis are the entities on which statistical analysis is done. In social science data units of analysis can vary a lot. The unit of analysis is often the individual. Normally a survey respondant, or a participant in an experiment. However, units of analysis can vary. They can be a class, a school, a company, or a region, state, or country.

Variables are the characteristics of units of analysis that vary across the units of analysis. In social science data, variables are often responses to individual survey questions: Each survey question is one variable. What an actual variable measures can vary widely. Variables can be as diverse as, for example, (1) the number of executions in the last year in a particular state/country, or (2) the ‘love of pineapple on pizza’ on a 0-10 scale, where 0 is hate, and 10 is love, and 5 is neutral.

Tip: How do we identify the unit of analysis?

  • they are the entities which are to be analysed
  • there should be a considerable number of them, because we analyse the difference across these units.
  • the units of analysis is often what we are saying something about - we might be saying that children who are bullied do worse at school. So our unit of analysis is a child, because that is the unit we are saying something about.
  • there should be variation across the units of analysis on key variables, particularly the hypothesised cause and the effect (i.e. the independent and dependent variables).


Tip: How do we identify a variable?

  • it is a characteristic of a unit of analysis
  • it needs to vary across units of analysis
  • it is measurable
  • it is normally a cause (independent variable), an effect (dependent variable), or it is a control variable (something we need to take account of, because it might explain an observed correlation between our DV and IV).


4. Dependent, Independent, and Control Variables: How do I distinguish between them?

In the scientific method we tend to distinguish between three main types of variables (but there are more!): dependent variables, independent variables, and control variables.

Dependent variables are the outcome we care about. They are the ‘thing’ we are trying to explain. Other names for dependent variable is “outcome variable”, or simply “the effect”.

Independent variables are the potential causes of our outcome. They are the reason why the dependent variable changes. Other names for the independent variable are “predictor variable”, or simply “the cause”.

Control variables are variables that might impact on the dependent variable, and so we need to take them into account to be sure the changes we see in the dependent variable are really cause by the independent variable, and not just the control variable.

Silly example: Punch in face

Let’s say you punch me in the face, and my nose bleeds.

From this you develop a hypothesis “that punches in the face tend to result in nose bleeding.”

So you get 100 pairs of people A and B. And for 50 pairs, A punches B in the face. And for 50 pairs, A pretends to punch B in the face, but stops and doesn’t hit them.

You could then measure how many people in each condition (punch and no punch) have bleeding noses.

In this example, the dependent variable (the outcome, the effect) is nose bleeding (or not). It is the outcome we are concerned to understand why it happens.

The independent variable (the predictor, the potential cause) is the punch in the face (or not).

Adding a control

But maybe someone says “You aren’t controlling for the fact that some people bleed easily. Maybe there are lots hemophiliacs in one of your groups, and this explains why some people bleed more than others.”

In this case, we would have a control variable called “hemophilia”, and each person would, hyperthetically, either have hemophilia, or not.


5. Conceptualisation: How do I properly conceptualise a variable?

All variables exist in two realms simulaniously. The realm of ideas, and the realm of tangable, measurable ‘things’. Variables in the realm of ideas are called conceptual variables. Variables in the realm of the tangible and measurable are called operational variables.

For example, we might say the variable of age, at a conceptual level, is “The amount of time that has past since the birth of a person.” And then we might say that the variable age, at the operational level, is a survey respondants answer to “How old are you?”, with the answer being measured in years.

While age seems straight forward, many social science concepts are not so easily conceptualised. For example, how would you conceptualise (define) (1) social class; (2) wealth; (3) happiness; (4) health; (5) quality of spousal relationship?

As you can see, conceptualising many sociological concepts is difficult.

Five tips for conceptualising variables

In the boxes below, are five tips for conceptualising variables:

  • Write out a definition
  • Identify and number the essential characteristics
  • Identify and number the non-essential characteristics
  • Give a concrete example
  • Give concrete non-examples

Definition: Write it out

The main way that social scientists formalise the conceptualisation of a variable is with a written definition.

A good technique for deciding on your own definition is to review the literature, and identify the exact wording of the definitions of your concept used by other authors and researchers.

You will notice that for most concepts, people don’t completely agree. This is normal. Untimately you need to choose what you think the best or most accurate definition is, and state it. You might briefly defend your reasoning, but remember you should keep this incredibly short, unless it is the main argument of your paper.

When writing a conceptual definition and explanation of a concept, I think four techniques are particularly useful:

  • identifying, and numbering, the essential characteristics
  • identifying, and numbering, the non-essential characteristics
  • giving one or more concrete example
  • giving one or more concrete ‘non-example’ (though you shouldn’t call it this, you should say something like “In contract, X is not an example of Y, because it is missing characteristic Z.”)


Essential Characteristics: Identify and number them

Essential characteristics are parts of the definition that MUST be present for the concept to exist.

If we take the example of age from above, we can identify at least three essential characteristics within the definition: “(1) The amount of time that has past since (2) the birth; (3) of a person.”


Non-Essential Characteristics: Identify and number them

Non-essential characteristics are part of a definition that TEND to be associated with the concept, but do not always necessarily accompany it.

To continue in the example of age, we could extend the definition by adding the following non-essential characteristics: “Greater age tends to be associated with (1) greater physical maturity; (2) greater emotional and intellectual maturity; (3) increased independence; (4) greater economic power and wealth; and (5) greater status in their community.”

Note that these non-essential characteristics are both

  1. not absolutely essential, for example, someone with physical or intellectual disability may not gain these characteristics as they age,
  2. generally assumed in almost all usage of the word age in social sciences. For example, when we read that a person or population is of greater age, we tend to think in terms of the non-essential characteristics.

For example, we might have a model of likelihood of crashing a car, and find that the older someone is, the lower their likelihood of having an accident. When we interpret the substantive meaning of this, we would probably say that it seems likely that “as people get older, they get more mature and more cautious and more experiences, so they have less crashes.”

So our non-essential characteristics are VERY IMPORTANT, even if they are not essential to a concept.


Examples: Give them. Make them concrete.

By providing examples of a concept, we often improve the clarity of our conceptualisations of variable. The concrete is more memorable for the reader. The concrete also forces the researcher out of the realm of the abstract, and into the practical.


Non-Examples: Give them. Make them concrete. But don’t use the word ‘non-example’

While this word is a little awkward, I think it is very useful. A non-example is something which is very similar to an example of the concept, but it is missing just one essential characteristic. By missing just one characteristic, it shows the importance of that characteristics in defining the concept.

Non-examples also bring attention to the aspect of a concept being emphasised.

Example of a non-example: What is a man? What is not a man?

We might define the concept of a ‘man’ as “A (1) mature, adult (2) male (3) human.”

An example of a ‘man’, might be “Joe”, who is a 35 year old male technician.

Three examples of people who look a lot like Joe, but aren’t ‘men’, are James, Jane, and Brutous.

  • James is a 15 year old male school student. While James is male, and is human, James is not yet 18 years of age, so he isn’t an adult, and therefore is not a man.
  • Jane is a 35 year old female technician. Jane is human, and she is over 18 years of age - so she is mature - but Jane is female, so she isn’t male, and therefore is not a man.
  • Brutous is a 35 year old male horse. Brutous is mature, and male, but he is not a human, so he isn’t a man.

Notice the word ‘non-example’ was not used in any of these descriptions. Notice that instead we talked about the essential characteristics which the different examples had and lacked, and how this meant they did or did not meet the definition of a ‘man’.


Summary: Conceptualisation of a variable

  • Conceptualisation of variables is the defining of them in the realm of ideas.
  • The main way we conceptualise a variable is through writing a definition.
  • We make our own definition by drawing on definitions from the academic literature.
  • Our definitions will tend to have (1) essential characteristics; and (2) non-essential characteristics, which together provide a comprehensive description of the variable in the realm of ideas.
  • We can clarify our definitions and conceptualisation by providing (1) examples - which show how all the characteristics in our definition come together in one concrete instance; and (2) non-examples - which show how a concrete instance that is missing just one essential characteristics is no longer an example of the concept.


6. How do I properly operationalise a variable?

Operationalisation involves developing an instrument for measuring your concept (conceptual variable). Social scientists use a wide variety of instruments to measure the real world - survey questions, direct observation, experiments, or counting of words in text.

What is the most common way social scientists operationalise variables? Survey questions.

Some rules for good operationalisation are:

  1. Copy validated measures from the existing literature. This is the most important rule. Unless there is an overwhelmingly good reason, use measures from the existing academic literature. Don’t make them up. Don’t copy from Survey Monkey or a blog. Why? (1) they are valid, (2) reliable, and (3) less likely to screw up and give meaningless or wrong answers.
  2. Use multiple measures. If you can measure something in more than one way, do. For example, asking six questions about someone’s attitude towards taxes is going to be more accurate than just one question. This is why scales and indexes are so useful.
  3. The more fine grained measure, the better. If you have a choice between a 3 and 5 point scale, choose the five point scale. And if you have the option for a 9 point or 100 point scale, that is even better. The exception is if (1) respondants don’t understand complex scales, or (2) respondants are less likely to answer fine grained scales (e.g. people tend to be happier to answer income questions that are not fine grained).
  4. Avoid long, double-barrelled, or confusing questions. In survey design, it is remarkable how difficult it is to write easy to read questions than have only one distinct and clear meaning.

7. How can I tell if a variable is measured as a categorical, binary, ordinal, or continuous (or interval) variable?

Computers that do statistics - and statisticians who design statistical models and algorithms - ultimately can only understand numbers. That means that virtually all data we use in statistical analysis needs to be stored as numbers.

In this class we are going to talk about four main types of numbers - units of measurement - which are used to represent almost all variables.

It is important to note that other textbooks, and other researchers will often use some variation on these words, with slightly different meanings. I’ve included a box with some other common terms used, so you can recognise them when you see them.

Note we are going to introduce a new term: values of a variable.

The values of a variable are the various values it can take. For example, we may have a variable “Female”, and it has two values: 0 and 1.

We can also have value labels, which attach to those values. For example, the value label attached to 0 might be “Not female”, and the value label attached to 1 might be “Female”.

Units of Measurement: Terms we will use in this class

Categorical variables: Variables with no meaningful ranking of the values that the variable can take. For example, a variable containing the colour of a dress. 0 = “Blue”, 1 = “Red”, 2 = “Green”, but the numbers attached to the variables are simply ‘boxes’ or ‘categories’. Green does not contain twice as much “colour” as Red.

Binary variables: Variables which take two distinct values. Normally they represent the presence (1) and absence (0) of something. For example, death, cured, pregnant, female. These are all variables that can be considered binary, though binary may not be the only way to conceptualise or store these variables (e.g. modern gender classificaitons).

Dummy variables: This is another name for a binary variable. However, it tends to be a binary variable which a researcher has made from another type of variable. There are two reasons we make dummy variables. Firstly, to make it possible to analyse categorical variables. If we have a categorical variable with six colours, we can’t do analysis on it as one variable with the values 0 to 5. Instead we create six ‘dummy variables’, were each colour has a variable, and the value is 1 if the colour is present, and 0 otherwise.

Ordinal variables: Variables where there is an order to the values, but the distance between them is not known or fixed. Ordinal comes from the word “ordered”. The classic ordinal variable is a Likert Item, such as the answer to a questions which says “How much do you agree with this statement … [insert statement]. Strongly Agree, Agree, Neutral, Disagree, Strongly Disagree.”

Continuous (or interval) variables: Variables where there is an order to the values, and the distance between values is constant. For example, Age, Income, Wealth, Years of Education, Consumer Price Index. Note that according to this classification ‘continuous’ variables are not necessarily strickly ‘continuous’ in the traditional sense. They might be ‘discrete’, e.g. broken into fixed categories. However, according to this classification, we don’t draw a strong distinction between continuous and discrete variables that have a clear fixed distance between values of the variable.


Units of Measurement: Other terms you might read or hear

Discrete vs continuous: Much of the literature will draw a strong distinction between ‘discrete variables’, which can and do only take particularly values (e.g. the whole numbers 1, 2, 3, 4), and distinguish these from ‘continous variables’, which can be infinitely subdivided (e.g. distance).

Interval vs ratio: Other literature draws a strong distinction between ‘interval’ variables and ‘ratio’ variables. Interval variables are said to not have ‘a true zero’, such as temperature in Celsius (where zero is an arbitrary number at which water freezes). Ratio variables, on the other hand, have a true zero, such as age, or years of education, or income (zero in these variables has a non-arbirary meaning, and zero is the ‘absence’ of the variable).

Nominal variable: Another name for a categorical variable. Nominal comes from the word ‘name’ - meaning that the categories are arbitrary - like a name - not numbered or ordered categories.

Count variable: A variable based on a count of a number of items in a set. For example, the number of car accidents of each driver in an insurers data base, or the number of sexual partners in a STD database. Count variables generally can’t be negative. Count variables also have particular, and interesting statistical distributions, based on the average number of counts of the variable in a population or sample.


Dummy variables: What are they? Why do we make them?

Dummy variables are another name for a binary variables. However, it tends to be a binary variable which a researcher has made from another type of variable. There are two reasons we make dummy variables. Firstly, to make it possible to analyse categorical variables. If we have a categorical variable with six colours, we can’t do analysis on it as one variable with the values 0 to 5. Instead we create six ‘dummy variables’, were each colour has a variable, and the value is 1 if the colour is present, and 0 otherwise.

Colour [text] Colour [categorical] Blue [dummy] Green [dummy] Yellow [dummy] Red [dummy] Orange [dummy] Purple [dummy]
Yellow 2 0 0 1 0 0 0
Green 1 0 1 0 0 0 0
Red 3 0 0 0 1 0 0
Yellow 2 0 0 1 0 0 0
Purple 5 0 0 0 0 0 1
Blue 0 1 0 0 0 0 0
Purple 5 0 0 0 0 0 1


Aside: R can sometimes transform our variables to numbers with the function ‘factor()’

We will learn that R (and other packages) have ways of getting around this - turning variables that are filled with characters (i.e. words, and letters) into what is called ‘factors’. However, as we shall learn, these factors are really just another way of transforming these variables into numbers, but in this case R handles the transformation ‘behind the scenes’, so we don’t need to see it.


Last updated on 12 August, 2019 by Dr Nicholas Harrigan (nicholas.harrigan@mq.edu.au)